OVHcloud Deployment
Deploy on OVHcloud Managed Kubernetes with European data sovereignty and AI Endpoints
Intermediate
1 - 3 hr
- OVHcloud account with API access (see below for setup)
- Pulumi installed locally
- kubectl command-line tool
- Python 3.11+ for CLI tools
- Basic command-line and Kubernetes familiarity
Deploy a production-ready TrustGraph environment on OVHcloud Managed Kubernetes with European data sovereignty using Infrastructure as Code.
Overview
This guide walks you through deploying TrustGraph on OVHcloud’s Managed Kubernetes Service (MKS) using Pulumi (Infrastructure as Code). The deployment automatically provisions a production-ready Kubernetes cluster integrated with OVHcloud’s AI Endpoints.
Pulumi is an open-source Infrastructure as Code tool that uses general-purpose programming languages (TypeScript/JavaScript in this case) to define cloud infrastructure. Unlike manual deployments, Pulumi provides:
- Reproducible, version-controlled infrastructure
- Testable and retryable deployments
- Automatic resource dependency management
- Simple rollback capabilities
Once deployed, you’ll have a complete TrustGraph stack running on OVHcloud infrastructure with:
- Managed Kubernetes cluster (2-node pool, configurable)
- OVHcloud AI Endpoints integration (Mistral Nemo Instruct)
- Complete monitoring with Grafana and Prometheus
- Web workbench for document processing and Graph RAG
- Secure secrets management
Why OVHcloud for TrustGraph?
OVHcloud offers unique advantages for global organizations:
- European Cloud Leader: Largest European cloud provider with 40+ data centers worldwide
- No Egress Fees: Unlimited outbound traffic included at no extra cost
- GDPR Native: Built-in compliance with European data protection standards
- Transparent Pricing: Predictable costs without hidden charges
- Anti-DDoS Included: Enterprise-grade protection at no extra cost
Ideal for organizations requiring European data sovereignty with global reach.
Getting ready
OVHcloud Account
You’ll need an OVHcloud account with API access. If you don’t have one:
- Sign up at https://www.ovh.com/
- Complete account verification
- Access the OVHcloud Control Panel
To create API credentials:
- Navigate to the OVHcloud API token creation page
- Fill in the form with:
- Application name: TrustGraph Deployment
- Application description: Pulumi deployment for TrustGraph
- Validity: Choose appropriate duration (or unlimited)
- Rights: Grant full access or specific rights for Kubernetes and AI services
- Click Create keys
- Save the Application Key, Application Secret, and Consumer Key securely
Python
You need Python 3.11 or later installed for the TrustGraph CLI tools.
Check your Python version
python3 --version
If you need to install or upgrade Python, visit python.org.
Pulumi
Install Pulumi on your local machine:
Linux
curl -fsSL https://get.pulumi.com | sh
MacOS
brew install pulumi/tap/pulumi
Windows
Download the installer from pulumi.com.
Verify installation:
pulumi version
Full installation details are at pulumi.com.
kubectl
Install kubectl to manage your Kubernetes cluster:
- Linux: Install kubectl on Linux
- MacOS:
brew install kubectl - Windows: Install kubectl on Windows
Verify installation:
kubectl version --client
Node.js
The Pulumi deployment code uses TypeScript/JavaScript, so you’ll need Node.js installed:
- Download: nodejs.org (LTS version recommended)
- Linux:
sudo apt install nodejs npm(Ubuntu/Debian) orsudo dnf install nodejs(Fedora) - MacOS:
brew install node
Verify installation:
node --version
npm --version
OVHcloud AI Endpoints
The deployment uses OVHcloud’s AI Endpoints service with Mistral Nemo Instruct as the default model. You’ll need to:
- Access OVHcloud AI Endpoints in the Control Panel
- Generate an AI Endpoints token for authentication
- Note the token for configuration later
OVHcloud AI Endpoints provides access to various AI models including Mistral, LLaMA 3, and Codestral, with processing available in European data centers.
Prepare the deployment
Get the Pulumi code
Clone the TrustGraph OVHcloud Pulumi repository:
git clone https://github.com/trustgraph-ai/pulumi-trustgraph-ovhcloud.git
cd pulumi-trustgraph-ovhcloud/pulumi
Install dependencies
Install the Node.js dependencies for the Pulumi project:
npm install
Configure OVHcloud credentials
Set the required OVHcloud environment variables using the credentials you created earlier:
export OVH_ENDPOINT=ovh-eu  # or ovh-ca, ovh-us based on your region
export OVH_APPLICATION_KEY="your_application_key_here"
export OVH_APPLICATION_SECRET="your_application_secret_here"
export OVH_CONSUMER_KEY="your_consumer_key_here"
Configure Pulumi state
You need to tell Pulumi which state to use. You can store this in an S3 bucket, but for experimentation, you can just use local state:
pulumi login --local
When storing secrets in the Pulumi state, pulumi uses a secret passphrase to encrypt secrets. When using Pulumi in a production or shared environment you would have to evaluate the security arrangements around secrets.
We’re just going to set this to the empty string, assuming that no encryption is fine for a development deploy.
export PULUMI_CONFIG_PASSPHRASE=
Create a Pulumi stack
Initialize a new Pulumi stack for your deployment:
pulumi stack init dev
You can use any name instead of dev - this helps you manage multiple deployments (dev, staging, prod, etc.).
Configure the stack
Apply settings for region, service name, and AI token. The service name is used to construct resource names:
pulumi config set ovhcloud:region GRA11  # or other available region
pulumi config set serviceName trustgraph-prod
pulumi config set --secret aiEndpointsToken your_ai_endpoints_token_here
Available regions include:
GRA11(Gravelines, France)SBG5(Strasbourg, France)BHS5(Beauharnois, Canada)DE1(Frankfurt, Germany)WAW1(Warsaw, Poland)
Refer to the repository’s README for more region options and configuration details.
Deploy with Pulumi
Preview the deployment
Before deploying, preview what Pulumi will create:
pulumi preview
This shows all the resources that will be created:
- Managed Kubernetes cluster
- Node pool with specified instance types
- Private network configuration
- Service account with AI Endpoints access
- Kubernetes secrets for API keys and configuration
- TrustGraph deployments, services, and config maps
Review the output to ensure everything looks correct.
Deploy the infrastructure
Deploy the complete TrustGraph stack:
pulumi up
Pulumi will ask for confirmation before proceeding. Type yes to continue.
The deployment typically takes 8 - 12 minutes and progresses through these stages:
- Creating Kubernetes cluster (5-7 minutes)
- Provisions Managed Kubernetes cluster
- Creates node pool
- Configures networking
- Configuring service account and secrets (1-2 minutes)
- Creates service account
- Sets up AI Endpoints access
- Creates Kubernetes secrets
- Deploying TrustGraph (4-6 minutes)
- Applies Kubernetes manifests
- Deploys all TrustGraph services
- Starts pods and initializes services
You’ll see output showing the creation progress of all resources.
Configure and verify kubectl access
After deployment completes, a configuration file permitting access to the Kubernetes cluster is written to kubeconfig.yaml. This file should be treated as a secret as it contains access keys for the Kubernetes cluster.
Check you can access the cluster:
export KUBECONFIG=$(pwd)/kubeconfig.yaml

# Verify access
kubectl get nodes
You should see your OVHcloud Managed Kubernetes nodes listed as Ready.
Check pod status
Verify that all pods are running:
kubectl -n trustgraph get pods
You should see output similar to this (pod names will have different random suffixes):
NAME                                        READY   STATUS      RESTARTS   AGE
agent-manager-74fbb8b64-nzlwb               1/1     Running     0          5m
api-gateway-b6848c6bb-nqtdm                 1/1     Running     0          5m
cassandra-6765fff974-pbh65                  1/1     Running     0          5m
pulsar-d85499879-x92qv                      1/1     Running     0          5m
text-completion-58ccf95586-6gkff            1/1     Running     0          5m
workbench-ui-5fc6d59899-8rczf               1/1     Running     0          5m
...
All pods should show Running status. Some init pods (names ending in -init) may fail or be shown Completed status - this is normal, their job is to initialise cluster resources and then exit.
Access services via port-forwarding
Since the Kubernetes cluster is running on Scaleway, you’ll need to set up port-forwarding to access TrustGraph services from your local machine.
Open three separate terminal windows and run these commands (keep them running):
Terminal 1 - API Gateway:
export KUBECONFIG=$(pwd)/kubeconfig.yaml
kubectl -n trustgraph port-forward svc/api-gateway 8088:8088
Terminal 2 - Workbench UI:
export KUBECONFIG=$(pwd)/kubeconfig.yaml
kubectl -n trustgraph port-forward svc/workbench-ui 8888:8888
Terminal 3 - Grafana:
export KUBECONFIG=$(pwd)/kubeconfig.yaml
kubectl -n trustgraph port-forward svc/grafana 3000:3000
With these port-forwards running, you can access:
- TrustGraph API: http://localhost:8088
- Web Workbench: http://localhost:8888
- Grafana Monitoring: http://localhost:3000
Keep these terminal windows open while you’re working with TrustGraph. If you close them, you’ll lose access to the services.
Install CLI tools
Now install the TrustGraph command-line tools. These tools help you interact with TrustGraph, load documents, and verify the system.
Create a Python virtual environment and install the CLI:
python3 -m venv env
source env/bin/activate  # On Windows: env\Scripts\activate
pip install trustgraph-cli
Set the IAM bootstrap token so that CLI tools can authenticate:
export TRUSTGRAPH_TOKEN=$(pulumi stack output iamToken --show-secrets)
Grafana access
Login to Grafana with username admin and the password from:
pulumi stack output grafanaPassword --show-secrets
Startup period
It can take 2-3 minutes for all services to stabilize after deployment. Services like Pulsar and Cassandra need time to initialize properly.
Verify system health
tg-verify-system-status
If everything is working, the output looks something like this:
============================================================
TrustGraph System Status Verification
============================================================

Phase 1: Infrastructure
------------------------------------------------------------
[00:00] ⏳ Checking Pulsar...
[00:03] ⏳ Checking Pulsar... (attempt 2)
[00:03] ✓ Pulsar: Pulsar healthy (0 cluster(s))
[00:03] ⏳ Checking API Gateway...
[00:03] ✓ API Gateway: API Gateway is responding

Phase 2: Core Services
------------------------------------------------------------
[00:03] ⏳ Checking Processors...
[00:03] ✓ Processors: Found 34 processors (≥ 15)
[00:03] ⏳ Checking Flow Classes...
[00:06] ⏳ Checking Flow Classes... (attempt 2)
[00:09] ⏳ Checking Flow Classes... (attempt 3)
[00:22] ⏳ Checking Flow Classes... (attempt 4)
[00:35] ⏳ Checking Flow Classes... (attempt 5)
[00:38] ⏳ Checking Flow Classes... (attempt 6)
[00:38] ✓ Flow Classes: Found 9 flow class(es)
[00:38] ⏳ Checking Flows...
[00:38] ✓ Flows: Flow manager responding (1 flow(s))
[00:38] ⏳ Checking Prompts...
[00:38] ✓ Prompts: Found 16 prompt(s)

Phase 3: Data Services
------------------------------------------------------------
[00:38] ⏳ Checking Library...
[00:38] ✓ Library: Library responding (0 document(s))

Phase 4: User Interface
------------------------------------------------------------
[00:38] ⏳ Checking Workbench UI...
[00:38] ✓ Workbench UI: Workbench UI is responding

============================================================
Summary
============================================================
Checks passed: 8/8
Checks failed: 0/8
Total time: 00:38

✓ System is healthy!
The Checks failed line is the most interesting and is hopefully zero. If you are having issues, look at the troubleshooting section later.
If everything appears to be working, the following parts of the deployment guide are a whistle-stop tour through various parts of the system.
Test LLM access
Test that OVHcloud AI Endpoints integration is working by invoking the LLM through the gateway:
tg-invoke-llm 'Be helpful' 'What is 2 + 2?'
You should see output like:
2 + 2 = 4
This confirms that TrustGraph can successfully communicate with OVHcloud’s AI Endpoints service.
Load sample documents
Load a small set of sample documents into the library for testing:
tg-load-sample-documents
This downloads documents from the internet and caches them locally. The download can take a little time to run.
Workbench
TrustGraph includes a web interface for document processing and Graph RAG.
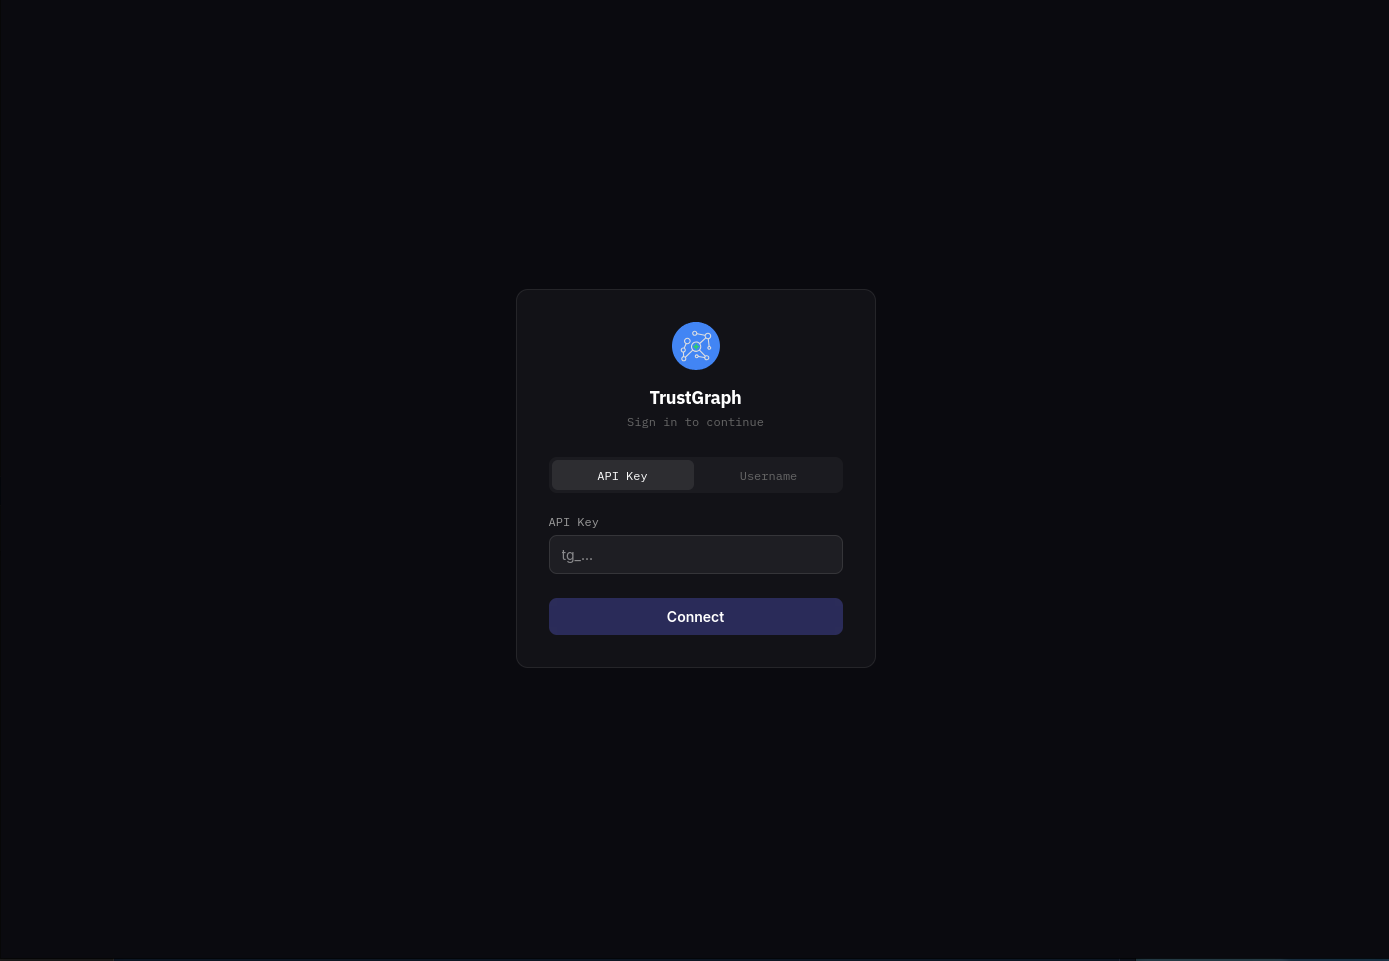
Access the TrustGraph workbench at http://localhost:8888 (requires port-forwarding to be running).
You will see a login page. Select the API Key tab and enter the IAM bootstrap token retrieved earlier, then click Connect.
After logging in, you should see the Workflows page showing the available workflows. At the top right of the screen is a Workflows button which brings you back to this page from anywhere in the workbench.
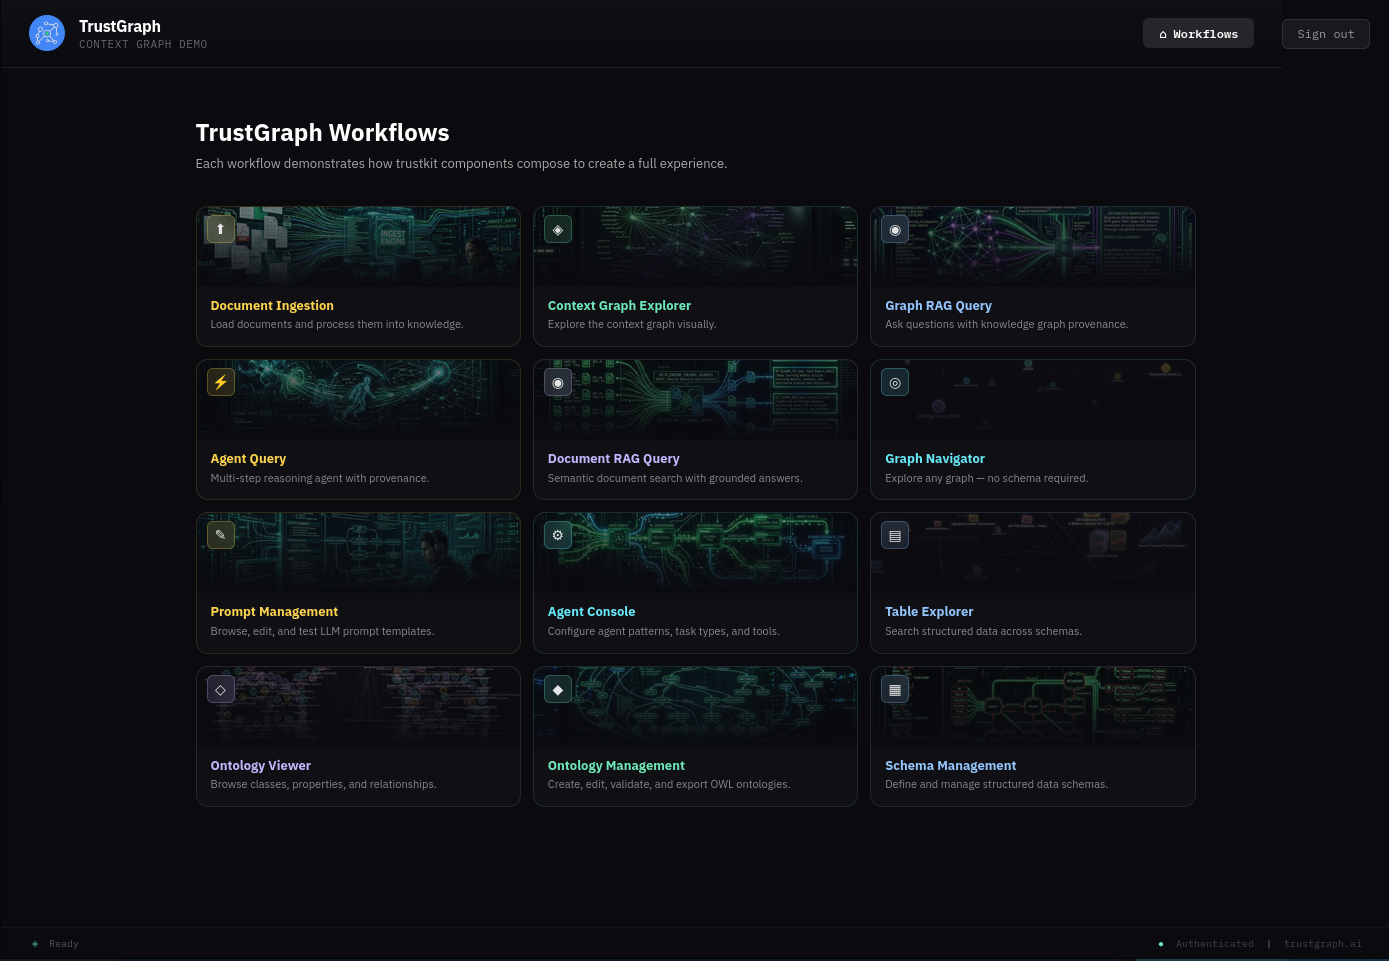
The guide will return to the workbench to load a document.
Monitoring dashboard
Access Grafana monitoring at http://localhost:3000 (requires port-forwarding to be running).
Default credentials:
- Username:
admin - Password:
admin
All TrustGraph components collect metrics using Prometheus and make these available using this Grafana workbench. The Grafana deployment is configured with 2 dashboards:
- Overview metrics dashboard: Shows processing metrics
- Logs dashboard: Shows collated TrustGraph container logs
For a newly launched system, the metrics won’t be particularly interesting yet.
Check the LLM is working
If the tg-invoke-llm command worked earlier, you can skip this section. Otherwise, this is a quick way to verify LLM access through the workbench while introducing the prompt management workflow.
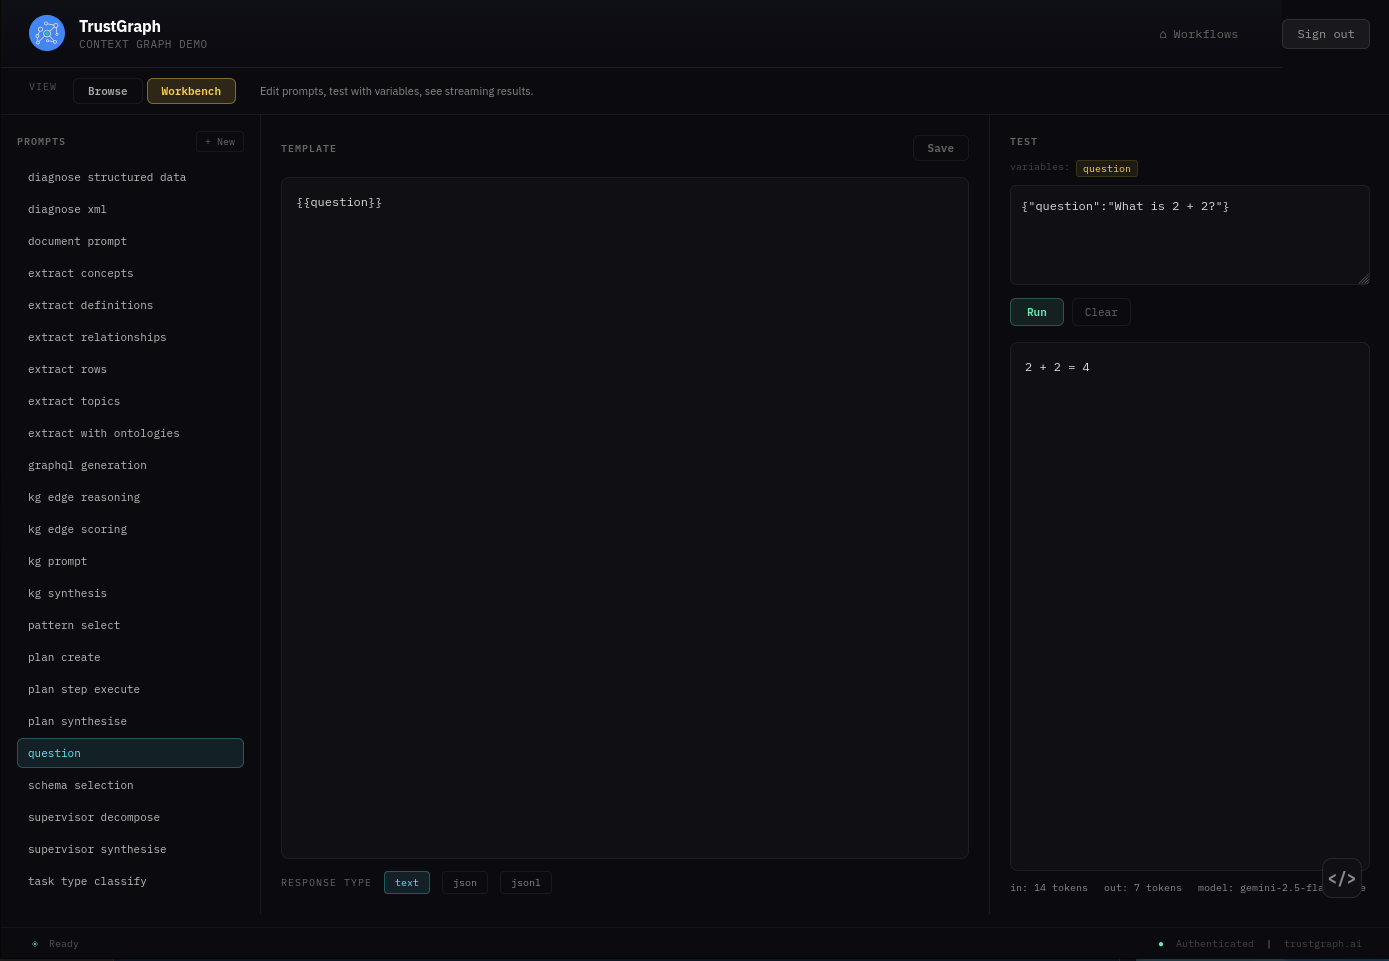
From the Workflows page, select Prompt Management. This screen is where all the prompt templates live. You can edit existing templates and construct your own.
To run a simple test, find the question prompt in the list on the left and select it. The template is straightforward — just {{question}} — which means the question variable is fed directly to the LLM.
On the right-hand side, change the TEST box from {} to:
{"question": "What is 2 + 2?"}
Click Run. You should see the answer to your question appear below.
If you want to experiment with prompts, try adding “Please provide a detailed explanation” to the prompt template, click Save, and run the test again to see a different response.
If LLM interactions are not working, check the Grafana logs dashboard for errors in the text-completion service.
Working with a document
Load a document
Back on the Workflows page, select Document Ingestion. If the sample documents were loaded earlier, you should see 7 documents listed.
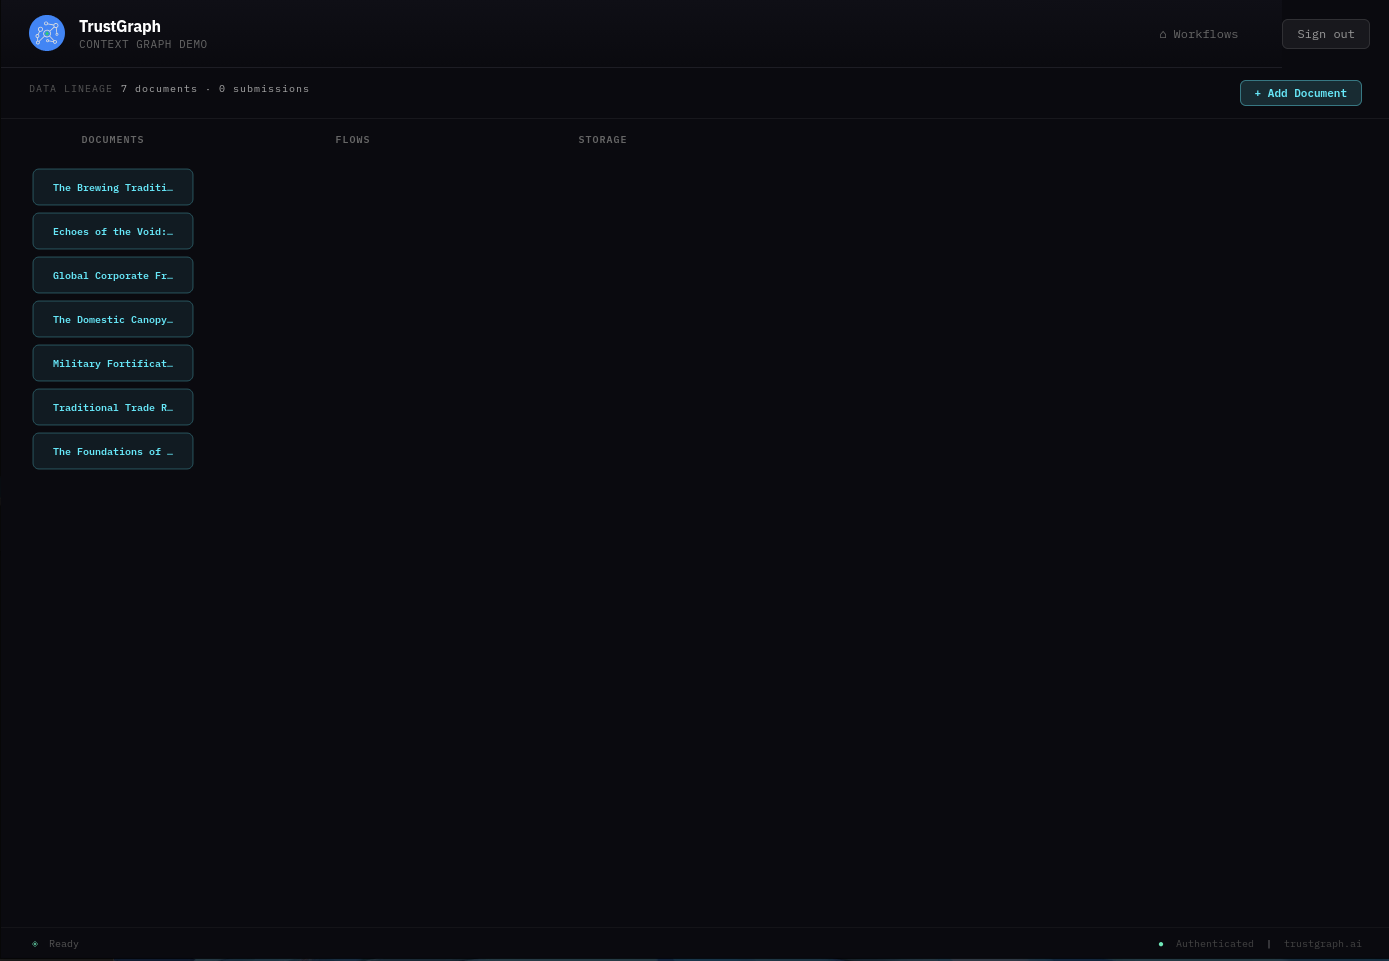
Find Echoes of the Void and select it. You should see document information including a description, tags, and upload date.
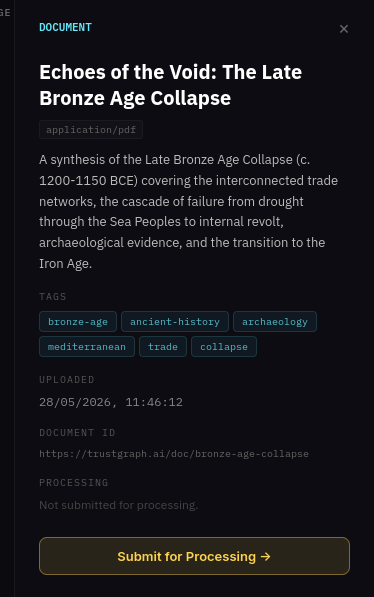
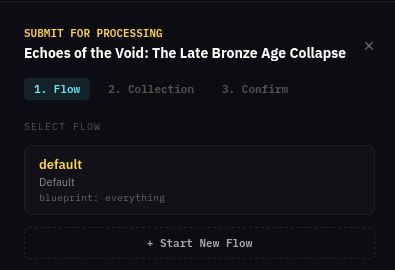
Click Submit for Processing. The submission wizard has three steps:
1. Select a flow — choose the default flow which already exists.
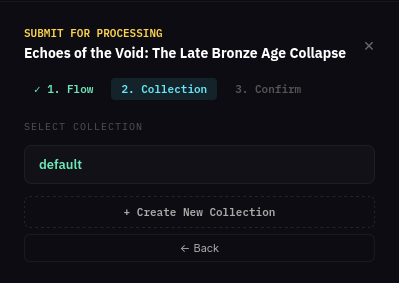
2. Select a collection — use the existing default collection.
3. Confirm — review the details and click Submit for Processing.
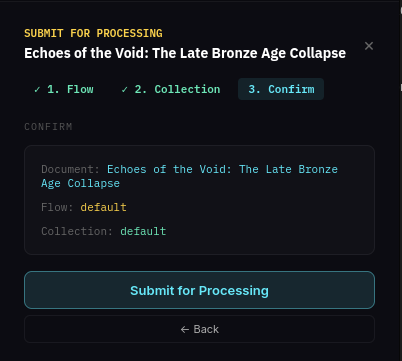
If submission is successful, the main screen should show the document’s processing pipeline — the document flowing through the selected flow into the storage backends.
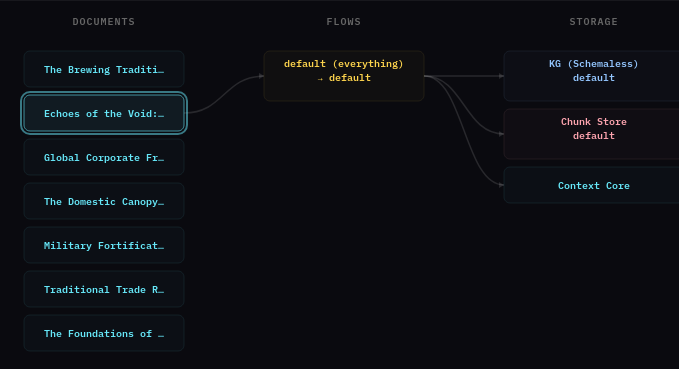
This is a short document and should process quickly, depending on the LLM resource you are using.
There is also an + Add Document button in the top right which can be used to submit your own documents.
Look at knowledge graph
From the Workflows page, select Graph Explorer. This shows what’s in the knowledge graph with tools for viewing and searching.
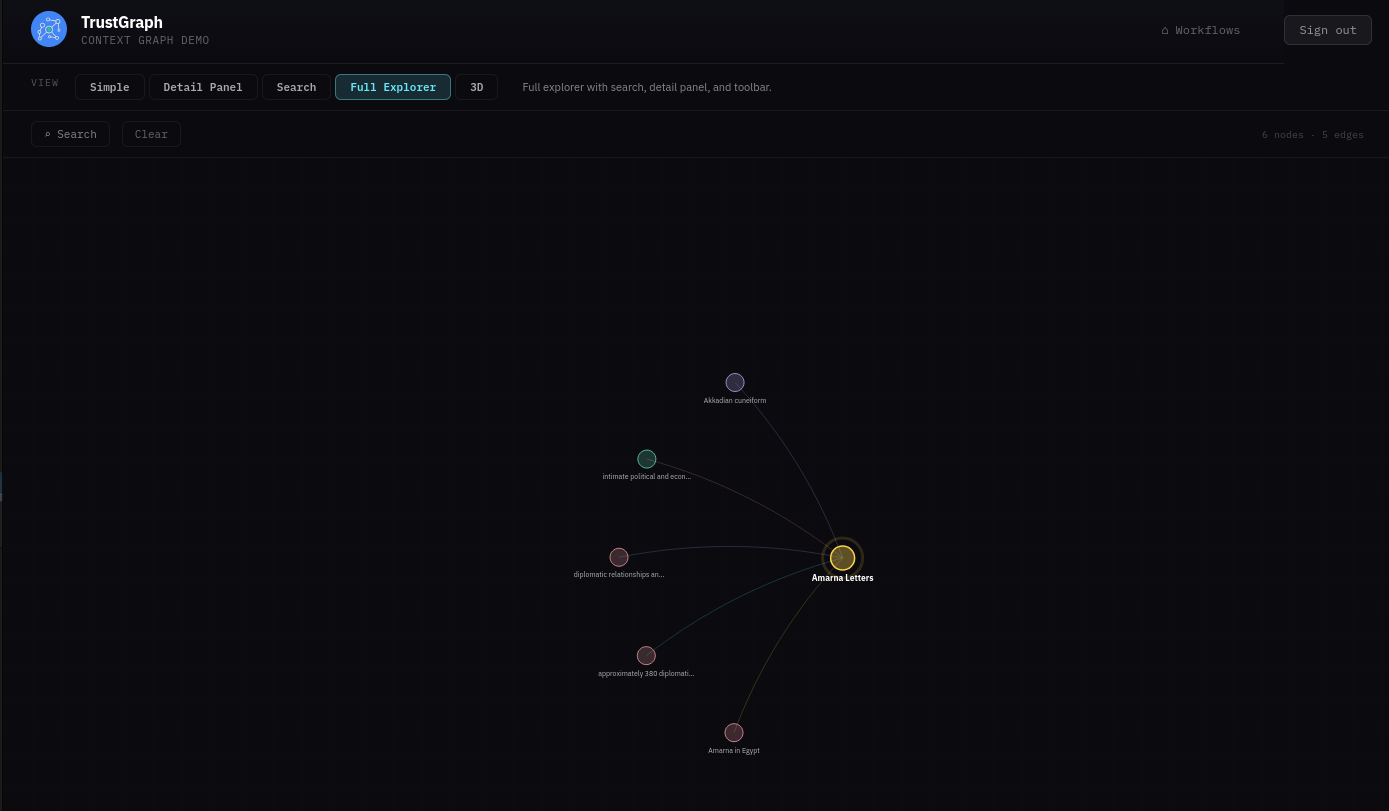
The graph can be easier to see in 3D — click the 3D button above the graph view.
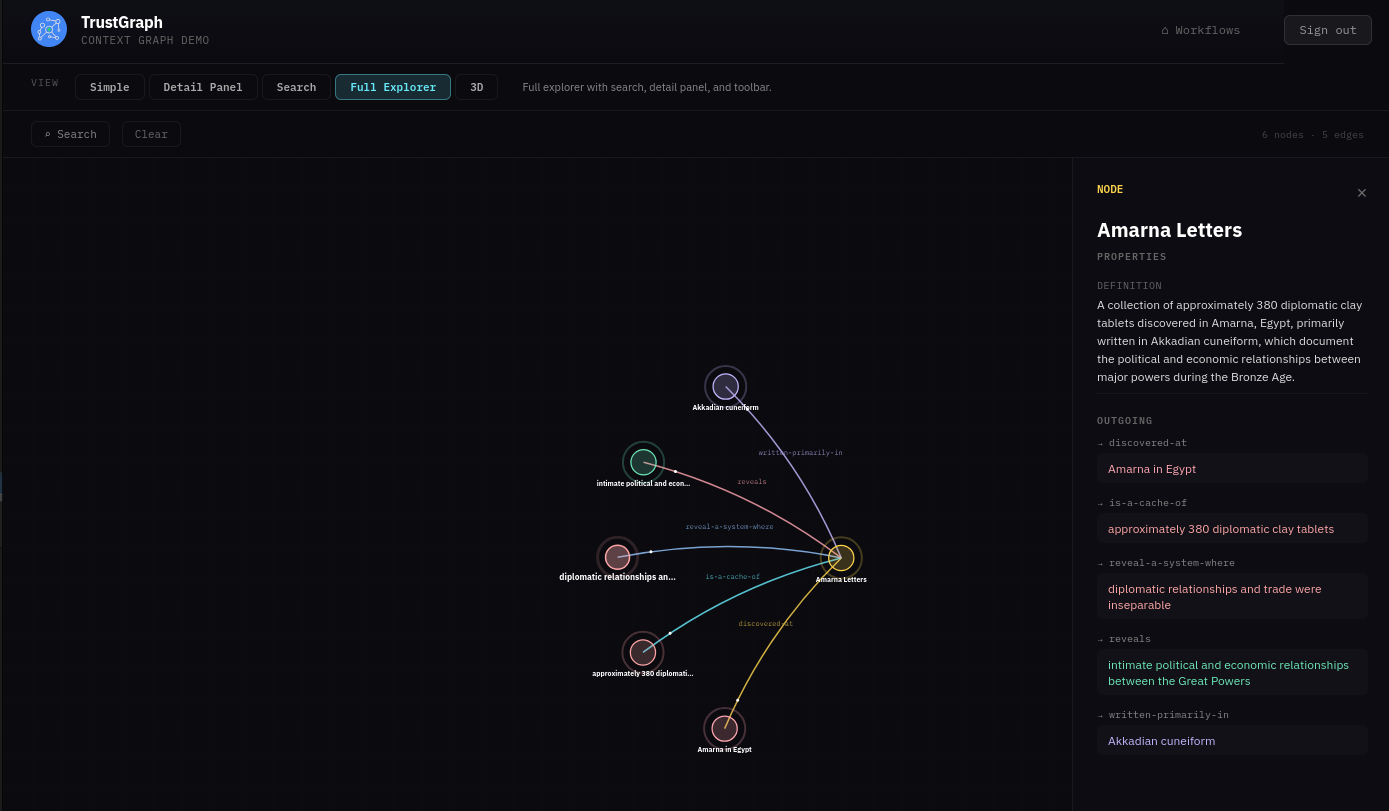
If you click a node, it will be highlighted along with its related edges. A side panel also appears showing node properties and highlighted links that allow you to navigate to related nodes.
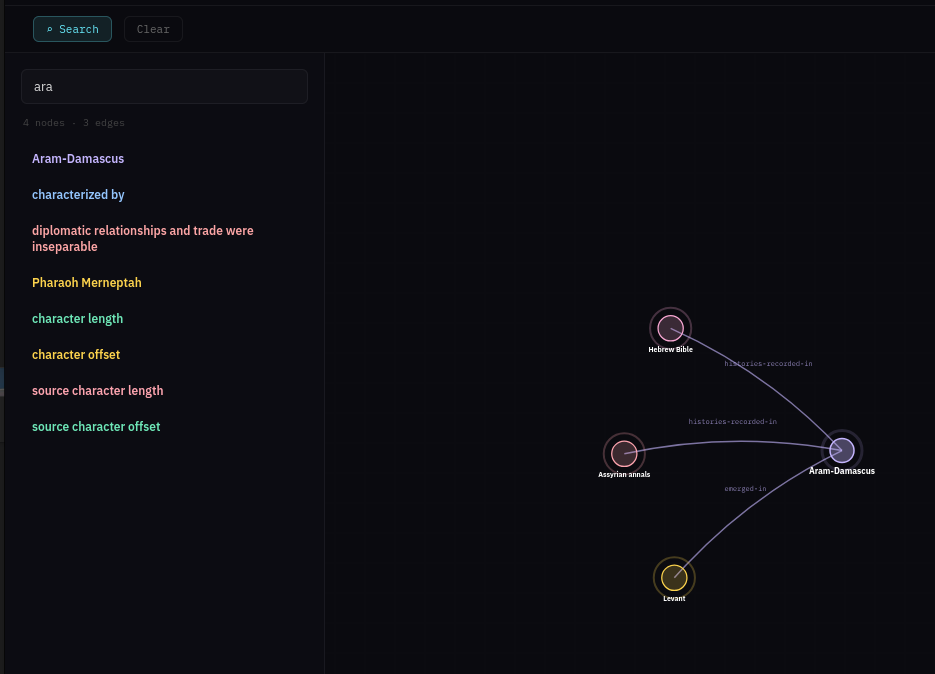
On the top left is a Search button which opens a search dialog. You can enter text for a similarity search against nodes in the graph. Matching nodes are listed and can be selected, which adds them to the graph along with their neighbours.
There is also a Clear button which resets the graph back to an empty state.
Query with Graph RAG
From the Workflows page, select Graph RAG Query. This console is more than your average chatbot — it has full Explainable AI enabled. This helps to understand and diagnose retrieval, but is not intended as an end-user experience.
Enter a query such as “What was the cause of the Bronze Age Collapse?” and after a short while you should see a response.
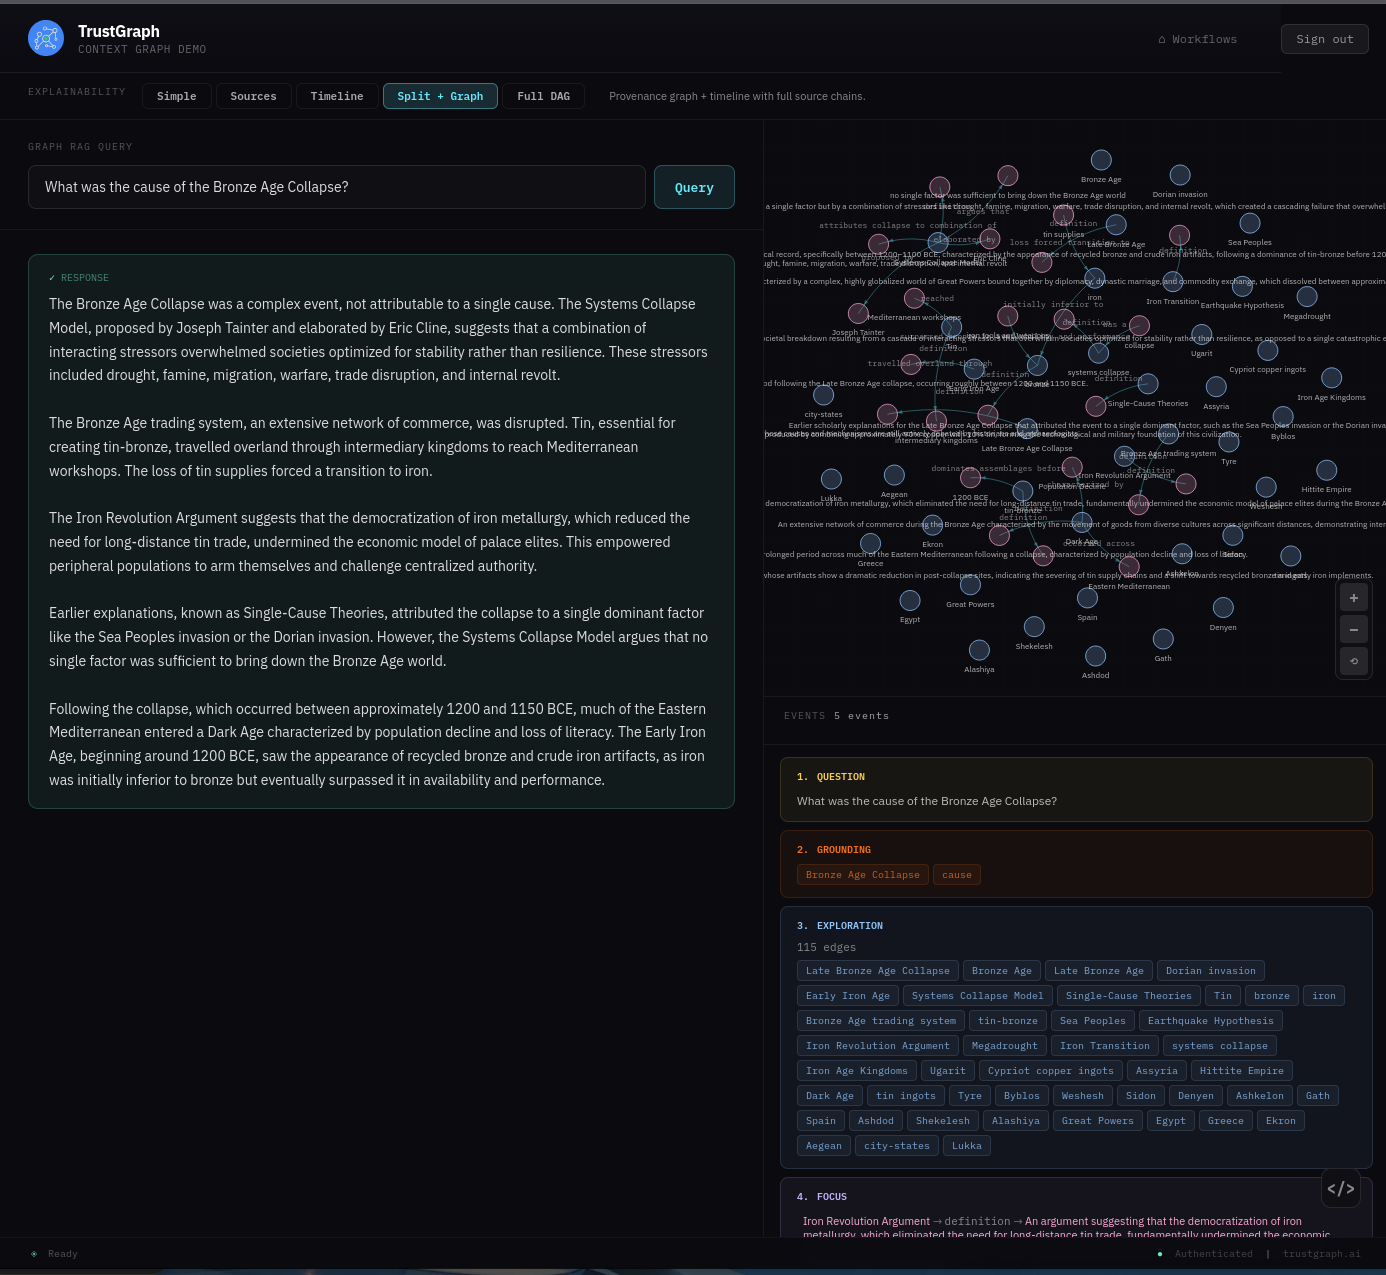
There is a lot to see here if you are interested. The bottom right part of the screen shows the various explainability events, starting from the question:
- Grounding — where retrieval selects key concepts for discovery
- Exploration — where graph nodes are selected for analytics
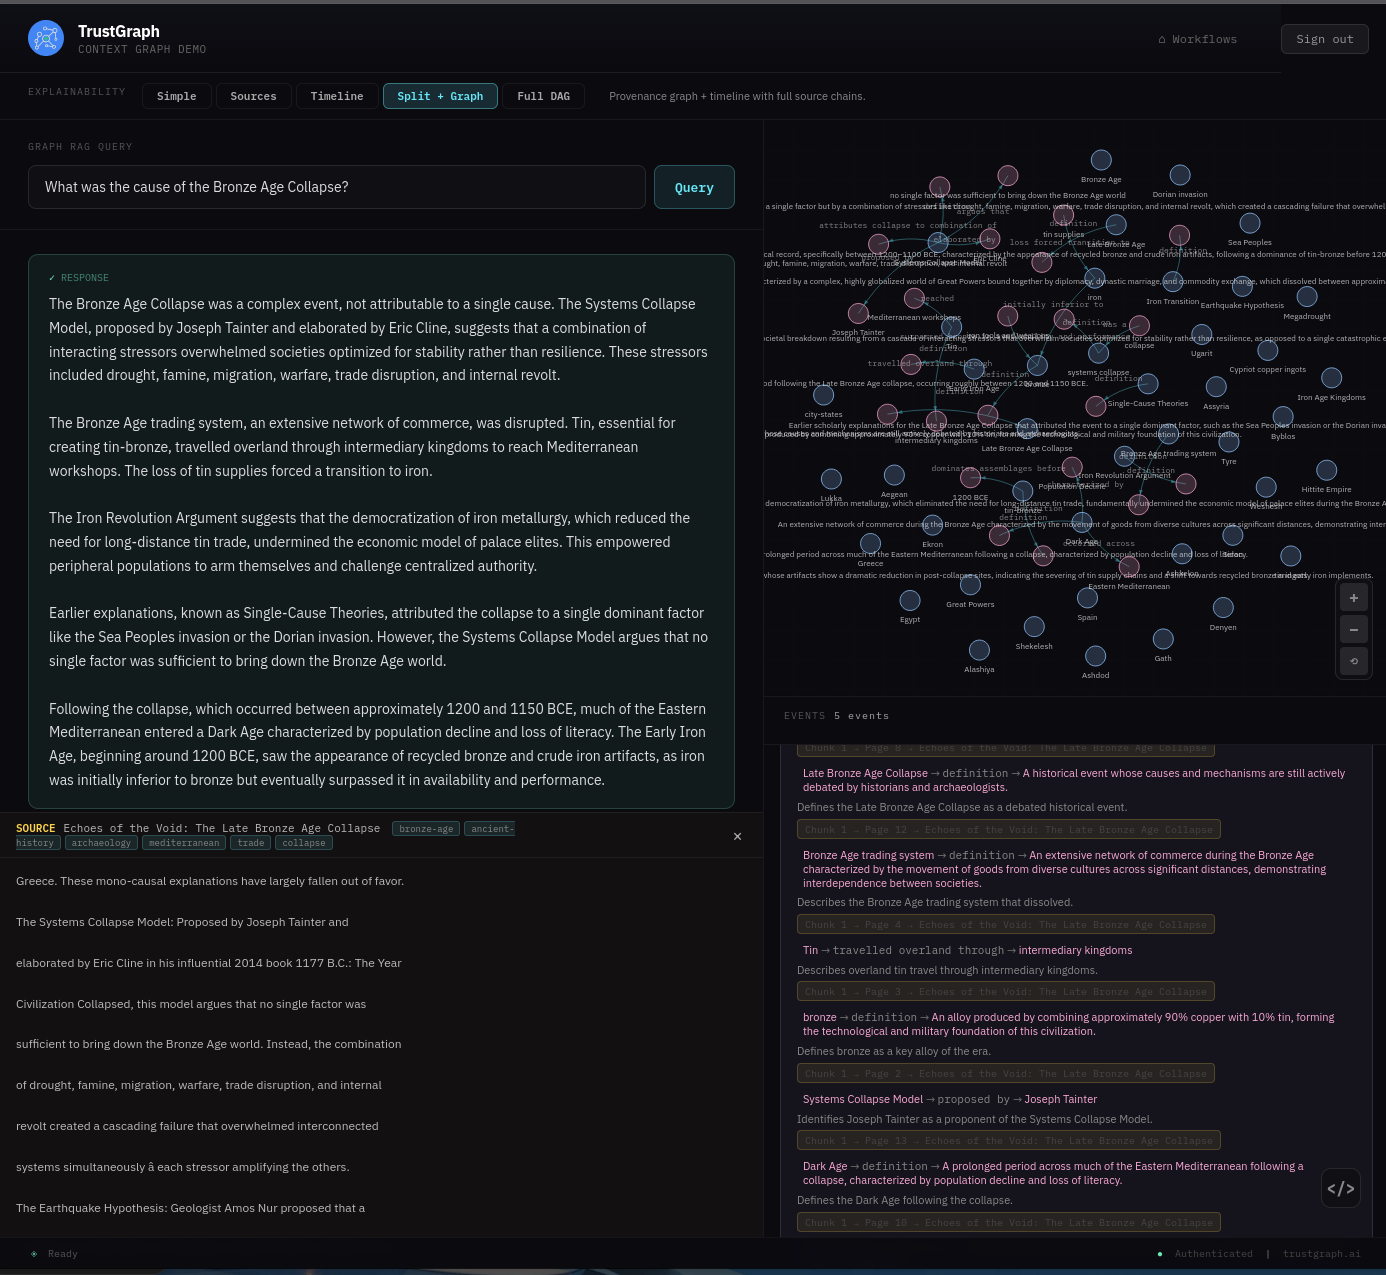
- Focus — where the system decides on a core set of graph edges to resolve the question
- Synthesis — where this is processed to provide an answer
On the left-hand side you see the actual answer to the query. The Focus event may be of particular interest as you can trace graph edges all the way back to the source documents. For example, the graph edge (Systems Collapse Model → proposed by → Joseph Tainter) has a link to source below which, when followed, shows the original source text.
Troubleshooting
Deployment Issues
Pulumi deployment fails
Diagnosis:
Check the Pulumi error output for specific failure messages. Common issues include:
# View detailed error information
pulumi stack --show-urns
pulumi logs
Resolution:
- Authentication errors: Verify your OVHcloud credentials are set correctly (
OVH_APPLICATION_KEY,OVH_APPLICATION_SECRET, etc.) - Quota limits: Check your OVHcloud account hasn’t hit resource quotas (Kubernetes clusters, nodes, etc.)
- Region availability: Ensure Managed Kubernetes is available in your selected region
- Permissions: Verify your API credentials have permissions to create Kubernetes clusters and access AI services
Pods stuck in Pending state
Diagnosis:
kubectl -n trustgraph get pods | grep Pending
kubectl -n trustgraph describe pod <pod-name>
Look for scheduling failures or resource constraints in the describe output.
Resolution:
- Insufficient resources: Increase node count or node type in your Pulumi configuration
- PersistentVolume issues: Check PV/PVC status with
kubectl -n trustgraph get pv,pvc - Node issues: Check node status with
kubectl get nodes
OVHcloud AI Endpoints integration not working
Diagnosis:
Test LLM connectivity:
tg-invoke-llm '' 'What is 2+2'
A timeout or error indicates AI Endpoints configuration issues. Check the text-completion pod logs:
kubectl -n trustgraph logs -l app=text-completion
Resolution:
- Verify OVHcloud AI Endpoints is enabled in your account
- Check that the AI Endpoints token is correct and has not expired
- Ensure the token secret was created correctly by Pulumi
- Review Pulumi outputs to confirm AI configuration:
pulumi stack output
Port-forwarding connection issues
Diagnosis:
Port-forward commands fail or connections time out.
Resolution:
- Verify
KUBECONFIGenvironment variable is set correctly - Check that the target service exists:
kubectl -n trustgraph get svc - Ensure no other process is using the port (e.g., port 8088, 8888, or 3000)
- Try restarting the port-forward with verbose logging:
kubectl port-forward -v=6 ...
Service Failure
Pods in CrashLoopBackOff
Diagnosis:
# Find crashing pods
kubectl -n trustgraph get pods | grep CrashLoopBackOff

# View logs from crashed container
kubectl -n trustgraph logs <pod-name> --previous
Resolution:
Check the logs to identify why the container is crashing. Common causes:
- Application errors (configuration issues)
- Missing dependencies (ensure all required services are running)
- Incorrect secrets or environment variables
- Resource limits too low
Service not responding
Diagnosis:
Check service and pod status:
kubectl -n trustgraph get svc
kubectl -n trustgraph get pods
kubectl -n trustgraph logs <pod-name>
Resolution:
- Verify the pod is running and ready
- Check pod logs for errors
- Ensure port-forwarding is active for the service
- Use
tg-verify-system-statusto check overall system health
Shutting down
Clean shutdown
When you’re finished with your TrustGraph deployment, clean up all resources:
pulumi destroy
Pulumi will show you all the resources that will be deleted and ask for confirmation. Type yes to proceed.
The destruction process typically takes 5-10 minutes and removes:
- All TrustGraph Kubernetes resources
- The Managed Kubernetes cluster
- Node pools
- Service accounts and API access
- All associated networking and storage
Cost Warning: OVHcloud charges for running Kubernetes clusters and nodes. Make sure to destroy your deployment when you’re not using it to avoid unnecessary costs.
Verify cleanup
After pulumi destroy completes, verify all resources are removed:
# Check Pulumi stack status
pulumi stack

# Verify no resources remain
pulumi stack --show-urns
You can also check the OVHcloud Control Panel to ensure the Managed Kubernetes cluster and associated resources are deleted.
Delete the Pulumi stack
If you’re completely done with this deployment, you can remove the Pulumi stack:
pulumi stack rm dev
This removes the stack’s state but doesn’t affect any cloud resources (use pulumi destroy first).
Next Steps
Now that you have TrustGraph running on OVHcloud:
- Guides: See Guides for things you can do with your running TrustGraph
- Scale the cluster: Modify your Pulumi configuration to add more nodes or change node types
- Integrate with OVHcloud services: Connect to Object Storage, databases, or other OVHcloud services
- Multi-region deployment: Deploy TrustGraph across multiple OVHcloud regions for high availability
- Production hardening: Review the GitHub repository for advanced configuration options
Additional Resources
For Pulumi-specific configuration details, customization options, and contributing to the deployment code, visit the TrustGraph OVHcloud Pulumi Repository