Docker/Podman compose deployment
Easiest way to get TrustGraph running locally with Docker or Podman for development and testing
Beginner
10 - 15 min
- Machine with 12GB+ RAM and 8 CPUs available for TrustGraph to use - a 16GB Macbook or laptop will probably cope
- Docker Engine or Podman installed (see below)
- Python 3 for CLI tools (see below)
- Access to an LLM (cloud service like VertexAI, AWS Bedrock, or local with Ollama)
- Basic command-line familiarity
Launch a complete TrustGraph environment locally using Docker or Podman for development, testing, and learning.
Overview
Docker and Podman are popular container hosting environments which run on many types of system. Docker was the original container engine and runs on Linux, MacOS and Windows. Podman uses the Linux-kernel container capabilities, and can also run on MacOS. Podman is an open-source alternative built to be highly compatible with Docker engine.
Docker and Podman both have a “compose” utility which lets you easily manage a group of running containers. This guide takes you through launching TrustGraph using Docker/Podman compose.
Using Docker/Podman is the easiest way to launch a TrustGraph, because you can run it on a standalone environment. If you have a desktop/laptop with enough resources, you can run TrustGraph directly on that device.
This is a good way to get started for local development and testing, proof-of-concept building, small-scale experiments, or just to learn more.
Getting ready
System resources
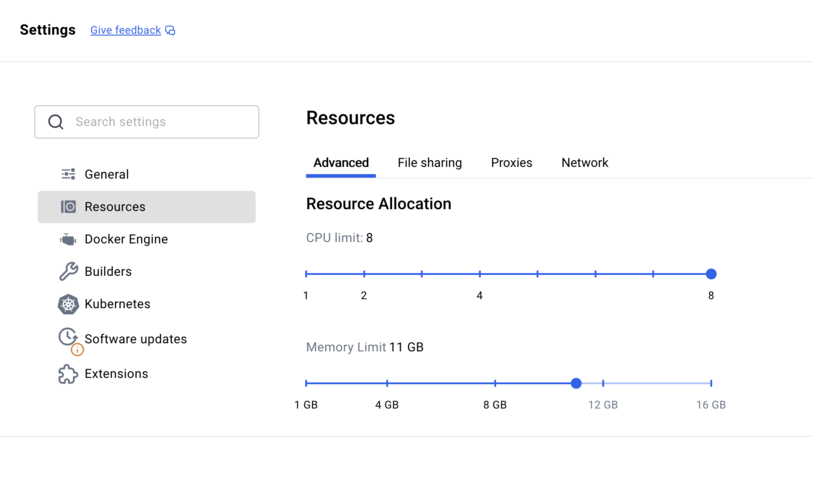
As mentioned above, you need a machine with at least 12GB of RAM and 8 CPUs available for TrustGraph. That means if you’re running other significant resources on it, it will probably fail. We can run TrustGraph on 16GB Macbook, but not when other things are running.
You can also deploy an instance to your favourite cloud provider and use that.
This has been tested with Linux, MacOS and Windows devices.
Python
You need Python 3.11 or later installed for the TrustGraph CLI tools.
Check your Python version
python3 --version
If you need to install or upgrade Python, visit python.org.
Docker / Podman
For Windows / MacOS it is recommended to use Docker. For Linux, Podman is natively available with all major distributions. You will need to have this installed before running this installation.
If you are using Docker desktop, you may need to review the resource settings as described in this section.
Resource settings for Docker desktop
Large Language Model
You need to have access to an LLM. TrustGraph can work with many different kinds of LLM. You can use a cloud-hosted service, or have an LLM hosted locally on your device or network. TrustGraph can work with small models which you can run on standard home/office equipment, but small models are still demanding on resources. A 16GB laptop is able to run an LLM but likely not at the same time as running all the containers which make up a TrustGraph deployment.
Here are some example ways to get an LLM to run:
| Provider | Description | Access type |
|---|---|---|
| Google Cloud VertexAI | This is a subscription-based service which is part of Google Cloud. The Gemini models are good and cost-effective. There are free credits for new users. | Cloud subscription |
| AWS Bedrock | Amazon’s managed LLM service with Claude, Mistral, and other models available. Running Claude on Bedrock is a good option. | Cloud subscription |
| Azure | Microsoft’s cloud subscription services include Machine Learning Services (MLS) and Cognitive Services (CS). The TrustGraph Azure integration can use the MLS service, while Azure OpenAI can use CS models. | Cloud subscription |
| Anthropic Claude | Integrates with Anthropic’s APIs directly for access to the Claude models. Claude models are very capable. | API subscription |
| Mistral AI | Integrates with Mistral’s APIs directly for access to the Mistral models. | API subscription |
| OpenAI | Integrates with OpenAI’s API for GPT models | API subscription |
| Ollama | Run models locally on your machine. Supports Llama, Mistral, and many others. | Self-hosted |
| vLLM | The most comprehensive self-hosted model engine | Self-hosted |
| LMStudio | Desktop application for running local LLMs with an OpenAI-compatible API. LMStudio is a very user-friendly experience, which makes it easier to diagnose and solve hosting problems. Note: LMStudio is free, but only for non-work-related use. | Self-hosted |
Using a cloud-hosted service is a good starting point - you will need a subscription, but no extra hardware. If you do want to run an LLM locally, you will need a device with a good GPU, and likely some experience of running this yourself as you may need to debug model / hosting issues.
A word on networking and self-hosting
If you are self-hosting a model on the same device you are intending to run TrustGraph, you will need to understand how to get TrustGraph to talk to your model service.
If you are trying to connect TrustGraph to a service running on the host, read Container networking and self-hosted models.
If you are trying to connect TrustGraph to a service running on WSL, read WSL networking and self-hosted models.
Prepare the deployment
Create configuration
Use the TrustGraph Configuration Builder to generate your deployment configuration. By default, the configurator selects the newest stable deployment. To be compatible with this installation guide, you should make sure to use version 2.4 or later.
Remember the version number it is set up to deploy, you will need to know that to install CLI tools!
- Select Deployment: Choose Docker Compose or Podman Compose
- Graph Store: Select Cassandra (recommended for ease of use)
- Vector Store: Select Qdrant (recommended for ease of use)
- Chunker Settings:
- Type: Recursive
- LLM Model: Choose your preferred model as discussed above
- Output Tokens: 2048 is a safe default, 4096 works for most models, 8192 for the biggest models
- Customization: Leave defaults
- Finish Deployment: Click ‘Generate’ and then Download the deployment bundle
Unpack the configuration
The configuration builder will download a .zip file containing your deployment configuration which will be downloaded to your device in e.g. a Downloads directory. You need to find that zip file, and interact with it in a terminal. You can use the unzip command to list the contents of the ZIP file. There should be a docker-compose.yaml file which is used to launch TrustGraph. There are also various configuration files for TrustGraph, Grafana, Garage, Loki and Prometheus.
unzip -l deploy.zip
The output should look something like this:
Archive:  deploy.zip
  Length      Date    Time    Name
---------  ---------- -----   ----
    26353  01-06-2026 23:04   docker-compose.yaml
   208539  01-06-2026 23:04   trustgraph/config.json
      581  01-06-2026 23:04   garage/garage.toml
     4084  01-06-2026 23:04   grafana/dashboards/log-dashboard.json
    36032  01-06-2026 23:04   grafana/dashboards/overview-dashboard.json
      336  01-06-2026 23:04   grafana/provisioning/dashboard.yml
      773  01-06-2026 23:04   grafana/provisioning/datasource.yml
     1518  01-06-2026 23:04   loki/local-config.yaml
     5259  01-06-2026 23:04   prometheus/prometheus.yml
---------                     -------
   283475                     9 files
You should use the terminal window to create a suitable directory for your work and unpack the ZIP file e.g.
mkdir -p ~/trustgraph
cd ~/trustgraph
unzip ~/Downloads/deploy.zip
It is possible that this is all you need to prepare to launch the containers. If you are having problems launching TrustGraph you might consider modifying the unpacked configuration for environments where container engines use stricter access policies:
Remove file access restrictions
The first thing you might try doing is add read permissions to the files for any user on your system. This may be necessary if your system has stricter access control policies on the files that can be read by containers.
find garage/ loki/ prometheus/ grafana/ trustgraph/ -type f | xargs chmod 644
find garage/ loki/ prometheus/ grafana/ trustgraph/ -type d | xargs chmod 755
This adds global-read access of these configuration files to any user on your system, which may be a problem if you have multiple users accessing the system.
Configure SElinux access controls
On Linux, if you are running SElinux, it may also be necessary to grant particular SElinux permissions to the configuration files so that they can be read by Linux:
sudo chcon -Rt svirt_sandbox_file_t garage/ loki/ grafana/ prometheus/ trustgraph/
Install CLI tools
You need to have access to TrustGraph client tools. In the terminal window you created above, install a virtual environment, and the TrustGraph CLI tools. Make sure the version number of the CLI tools matches the version you chose to build a configuration for earlier, e.g. replace 2.4.29 with the version you used earlier.
python3 -m venv env
. env/bin/activate
pip install trustgraph-cli==2.4.29
Configure LLM settings
Depending on which LLM you selected, there are some configuration settings you need to prepare:
Specific guidance for Azure
There are 2 hosted model options for Azure:
- Machine Learning Services (MLS)
- Cognitive Services (CS)
TrustGraph’s Azure is for integration with MLS. Azure OpenAI is for integration with CS. If you are using the Azure / MLS integration, you should make sure you know your model endpoint, and the token granted for the endpoint, and configure these values thus:
export AZURE_ENDPOINT=https://ENDPOINT.API.HOST.GOES.HERE/
export AZURE_TOKEN=TOKEN-GOES-HERE
If you are using the Azure OpenAI / CS integration, you should make sure you know your model endpoint, the token, the API version and the model name, and configure them thus:
export AZURE_ENDPOINT=https://ENDPOINT.API.HOST.GOES.HERE/
export AZURE_TOKEN=TOKEN-GOES-HERE
export AZURE_API_VERSION=API-VERSION-GOES-HERE
export AZURE_MODEL=MODEL-NAME-GOES-HERE
The endpoint is typically of the form https://CUSTOM_NAME.cognitiveservices.azure.com/. The API version defaults to 2024-12-01-preview if not specified. The model name is the name of the model deployment (e.g. gpt-4o-mini).
Specific guidance for AWS Bedrock
To use Bedrock, you need to have AWS credentials provisioned. The easiest way is to create an IAM user, and create credentials for this user. When you provision the user, you will be asked to give the user permissions. To allow Bedrock access, the AmazonBedrockFullAccess role should be added.
You would then provision credentials which would give you an access key ID and a secret access key. You should pick the identifier of an AWS region to connect to e.g. eu-west-2. In order to prepare to deploy, you should set three environment variables using the information.
export AWS_ACCESS_KEY_ID=ID-KEY-HERE
export AWS_SECRET_ACCESS_KEY=TOKEN-GOES-HERE
export AWS_DEFAULT_REGION=AWS-REGION-HERE
Note: You should be very careful with AWS cloud credentials provisioned this way: if lost or leaked this provides a malicious person access to the AWS resources you gave this user.
Specific guidance for Anthropic Claude
To use Anthropic’s Claude models directly, sign up for API access at console.anthropic.com. Create an API key from the dashboard. Set the key as an environment variable:
export CLAUDE_KEY=sk-ant-api03-xxxxx
Specific guidance for Cohere
To use Cohere’s models, sign up at cohere.com and create an API key from your dashboard. Set the key as an environment variable:
export COHERE_KEY=your-cohere-api-key-here
Specific guidance for Google AI Studio
To use Google’s Gemini models via AI Studio, visit aistudio.google.com and generate an API key. Set the key as an environment variable:
export GOOGLE_AI_STUDIO_KEY=your-api-key-here
Specific guidance for Llamafile / llama.cpp server
If running a llamafile or llama.cpp server locally, configure the URL to point to your server. The URL must include the /v1 path:
export LLAMAFILE_URL=http://your-server-host:port/v1
If running on the same host as your containers, use host.containers.internal as the hostname (e.g., http://host.containers.internal:7000/v1).
Specific guidance for LMStudio
If running LMStudio locally, configure the URL to point to your LMStudio server. LMStudio typically runs on port 1234:
export LMSTUDIO_URL=http://your-server-host:1234/
If running on the same host as your containers, use host.containers.internal as the hostname (e.g., http://host.containers.internal:1234/).
Specific guidance for Mistral AI
To use Mistral’s API, sign up at console.mistral.ai and create an API key. Set the key as an environment variable:
export MISTRAL_TOKEN=your-mistral-api-key-here
Specific guidance for Ollama
If running Ollama locally, configure the URL to point to your Ollama server. Ollama typically runs on port 11434:
export OLLAMA_HOST=http://your-server-host:11434
If running on the same host as your containers, use host.containers.internal as the hostname (e.g., http://host.containers.internal:11434).
Specific guidance for OpenAI
To use OpenAI’s API, sign up at platform.openai.com and create an API key. Set the key as an environment variable:
export OPENAI_TOKEN=your-openai-api-key-here
Many other services provide OpenAI-compatible APIs. You can use these by setting the OPENAI_BASE_URL environment variable to point to the alternative service:
export OPENAI_BASE_URL=http://your-server-host:8000/v1
Specific guidance for Google Cloud VertexAI
To use Google Cloud VertexAI, you need to create a service account with appropriate permissions and download its credentials file.
- In Google Cloud Console, create a service account
- Grant the service account permissions to invoke VertexAI models (e.g.,
Vertex AI Userrole - use minimal permissions, not admin roles) - Create and download a JSON key file for the service account
- Save the key file as
vertexai/private.jsonin your deployment directory
Important: Service account credentials provide access to your Google Cloud resources. Never commit private.json to version control. Use minimal permissions - grant only what’s needed for VertexAI model invocation, not administrator roles.
After placing the file, you may need to adjust file permissions as described earlier in the configuration unpacking section:
chmod 644 vertexai/private.json
On SELinux systems, also run:
sudo chcon -Rt svirt_sandbox_file_t vertexai/
Specific guidance for vLLM
If running vLLM locally, configure the URL to point to your vLLM server. The URL should include the /v1 path:
export VLLM_URL=http://your-server-host:port/v1
If running on the same host as your containers, use host.containers.internal as the hostname (e.g., http://host.containers.internal:8000/v1).
Configure security settings
On first cold start, TrustGraph creates a security account with an API token initialised from the IAM_BOOTSTRAP_TOKEN environment variable. This value is only used for the initial cold start — once the system is running, you can add accounts and change API tokens through the workbench.
The IAM_BOOTSTRAP_TOKEN must have a tg_ prefix so that it is recognised as a valid API key.
The Grafana admin account password is set from the GF_SECURITY_ADMIN_PASSWORD environment variable.
Set these before launching TrustGraph:
export IAM_BOOTSTRAP_TOKEN="tg_my-secret-token"
export GF_SECURITY_ADMIN_PASSWORD="my-grafana-password"
Replace the values above with your own secrets.
Launch TrustGraph
docker-compose -f docker-compose.yaml up -d
podman-compose -f docker-compose.yaml up -d
Authenticate CLI tools
All CLI access requires TRUSTGRAPH_TOKEN to be set to a valid API token:
export TRUSTGRAPH_TOKEN="${IAM_BOOTSTRAP_TOKEN}"
Startup period
It can take around 40 - 120 seconds for all services to stabilize. Services like Pulsar and Cassandra need time to initialize properly. There is a utility which runs a series of checks to verify the system as it starts and reports when the system is working successfully.
Verify system health
tg-verify-system-status
If everything is working, the output looks something like this:
============================================================
TrustGraph System Status Verification
============================================================

Phase 1: Infrastructure
------------------------------------------------------------
[00:00] ⏳ Checking Pulsar...
[00:03] ⏳ Checking Pulsar... (attempt 2)
[00:03] ✓ Pulsar: Pulsar healthy (0 cluster(s))
[00:03] ⏳ Checking API Gateway...
[00:03] ✓ API Gateway: API Gateway is responding

Phase 2: Core Services
------------------------------------------------------------
[00:03] ⏳ Checking Processors...
[00:03] ✓ Processors: Found 34 processors (≥ 15)
[00:03] ⏳ Checking Flow Classes...
[00:06] ⏳ Checking Flow Classes... (attempt 2)
[00:09] ⏳ Checking Flow Classes... (attempt 3)
[00:22] ⏳ Checking Flow Classes... (attempt 4)
[00:35] ⏳ Checking Flow Classes... (attempt 5)
[00:38] ⏳ Checking Flow Classes... (attempt 6)
[00:38] ✓ Flow Classes: Found 9 flow class(es)
[00:38] ⏳ Checking Flows...
[00:38] ✓ Flows: Flow manager responding (1 flow(s))
[00:38] ⏳ Checking Prompts...
[00:38] ✓ Prompts: Found 16 prompt(s)

Phase 3: Data Services
------------------------------------------------------------
[00:38] ⏳ Checking Library...
[00:38] ✓ Library: Library responding (0 document(s))

Phase 4: User Interface
------------------------------------------------------------
[00:38] ⏳ Checking Workbench UI...
[00:38] ✓ Workbench UI: Workbench UI is responding

============================================================
Summary
============================================================
Checks passed: 8/8
Checks failed: 0/8
Total time: 00:38

✓ System is healthy!
The Checks failed line is the most interesting and is hopefully zero. If you are having issues, look at the troubleshooting section later.
If everything appears to be working, the following parts of the deployment guide are a whistle-stop tour through various parts of the system.
Load sample documents
Load a small set of sample documents into the library for testing:
tg-load-sample-documents
This downloads documents from the internet and caches them locally. The download can take a little time to run.
Workbench
TrustGraph includes a web interface for document processing and Graph RAG.
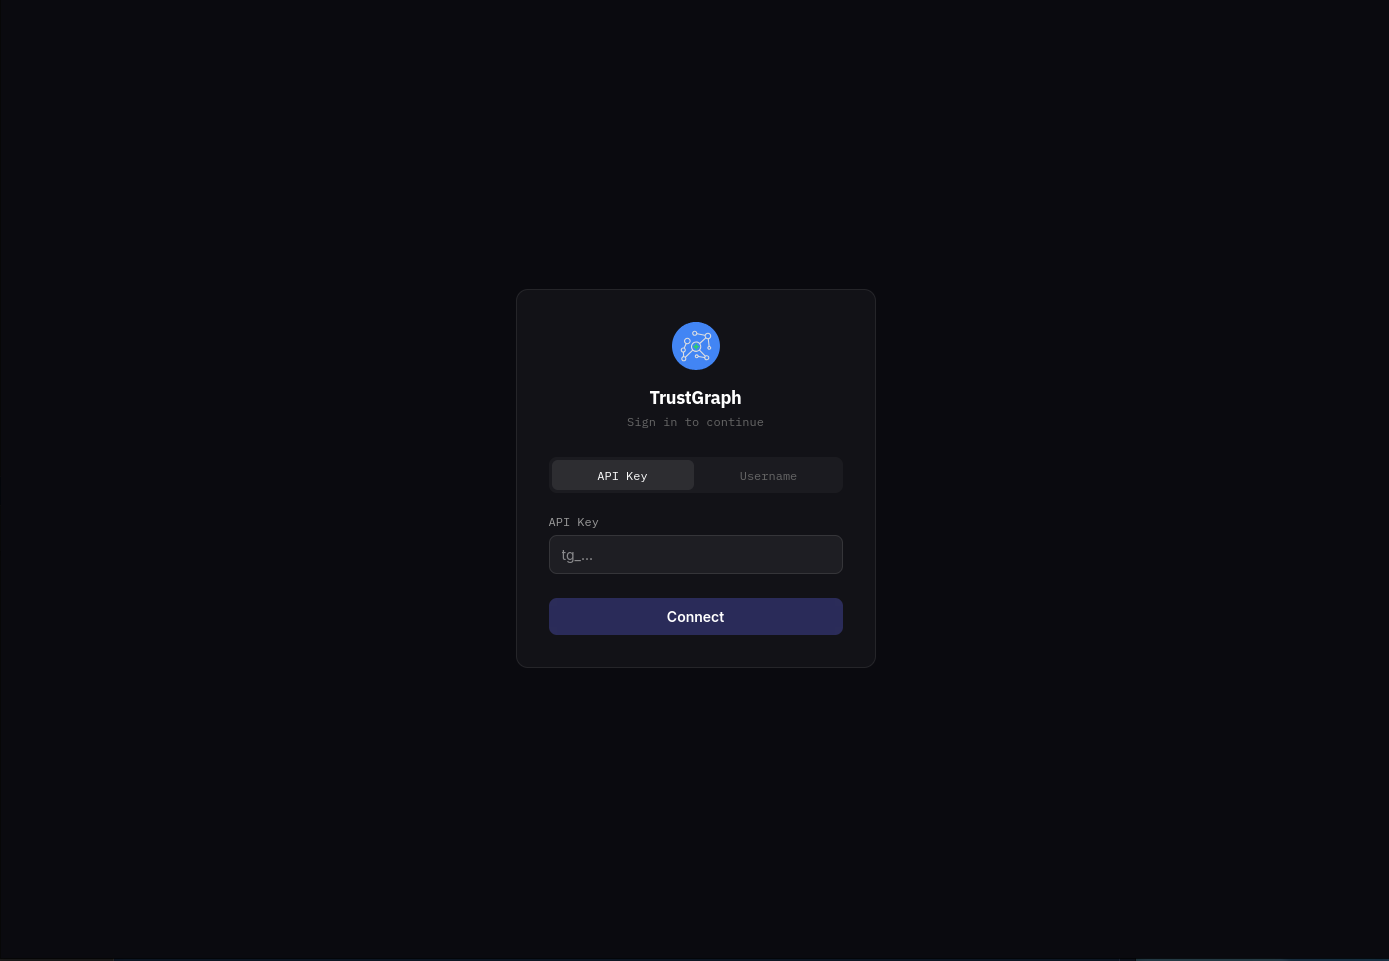
Access the TrustGraph workbench at http://localhost:8888 (requires port-forwarding to be running).
You will see a login page. Select the API Key tab and enter the IAM bootstrap token retrieved earlier, then click Connect.
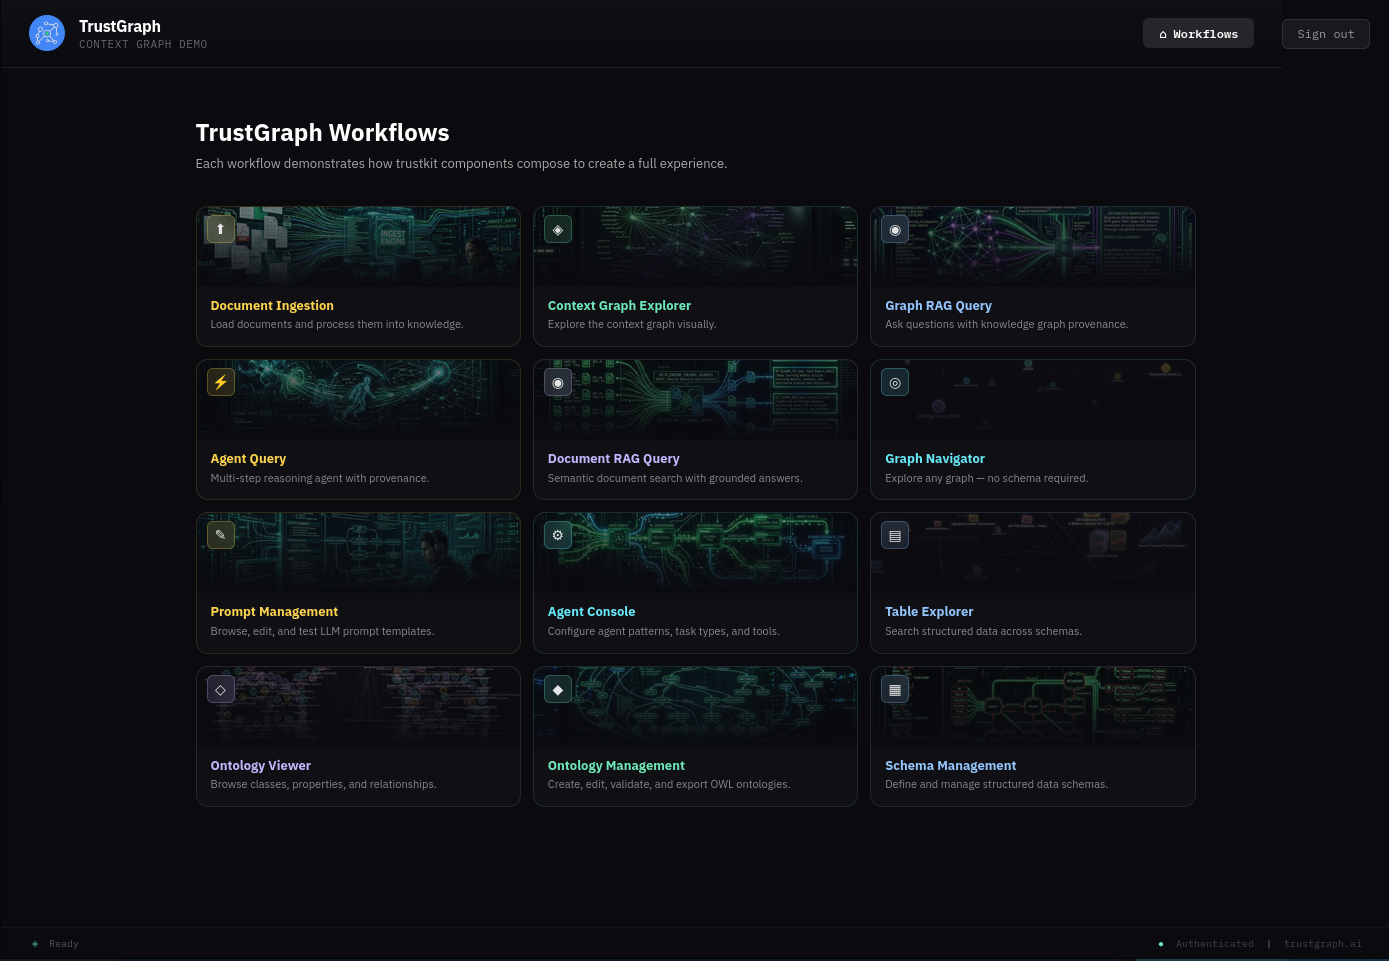
After logging in, you should see the Workflows page showing the available workflows. At the top right of the screen is a Workflows button which brings you back to this page from anywhere in the workbench.
The guide will return to the workbench to load a document.
Grafana access
Login to Grafana with username admin and the password you set in GF_SECURITY_ADMIN_PASSWORD earlier.
Monitoring dashboard
Access Grafana monitoring at http://localhost:3000 (requires port-forwarding to be running).
Default credentials:
- Username:
admin - Password:
admin
All TrustGraph components collect metrics using Prometheus and make these available using this Grafana workbench. The Grafana deployment is configured with 2 dashboards:
- Overview metrics dashboard: Shows processing metrics
- Logs dashboard: Shows collated TrustGraph container logs
For a newly launched system, the metrics won’t be particularly interesting yet.
Check the LLM is working
If the tg-invoke-llm command worked earlier, you can skip this section. Otherwise, this is a quick way to verify LLM access through the workbench while introducing the prompt management workflow.
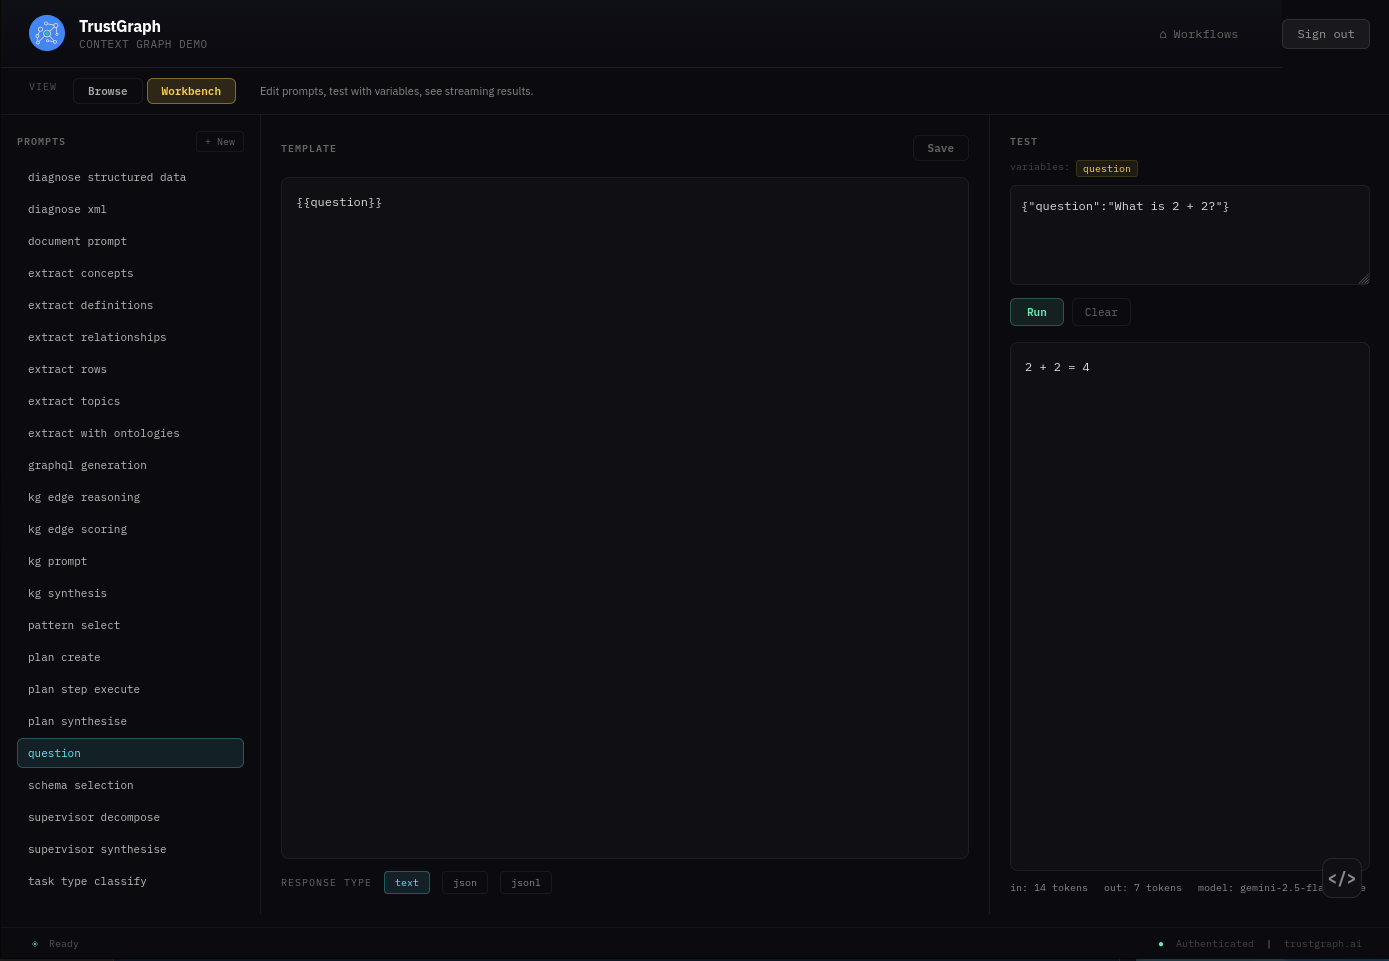
From the Workflows page, select Prompt Management. This screen is where all the prompt templates live. You can edit existing templates and construct your own.
To run a simple test, find the question prompt in the list on the left and select it. The template is straightforward — just {{question}} — which means the question variable is fed directly to the LLM.
On the right-hand side, change the TEST box from {} to:
{"question": "What is 2 + 2?"}
Click Run. You should see the answer to your question appear below.
If you want to experiment with prompts, try adding “Please provide a detailed explanation” to the prompt template, click Save, and run the test again to see a different response.
If LLM interactions are not working, check the Grafana logs dashboard for errors in the text-completion service.
Working with a document
Load a document
Back on the Workflows page, select Document Ingestion. If the sample documents were loaded earlier, you should see 7 documents listed.
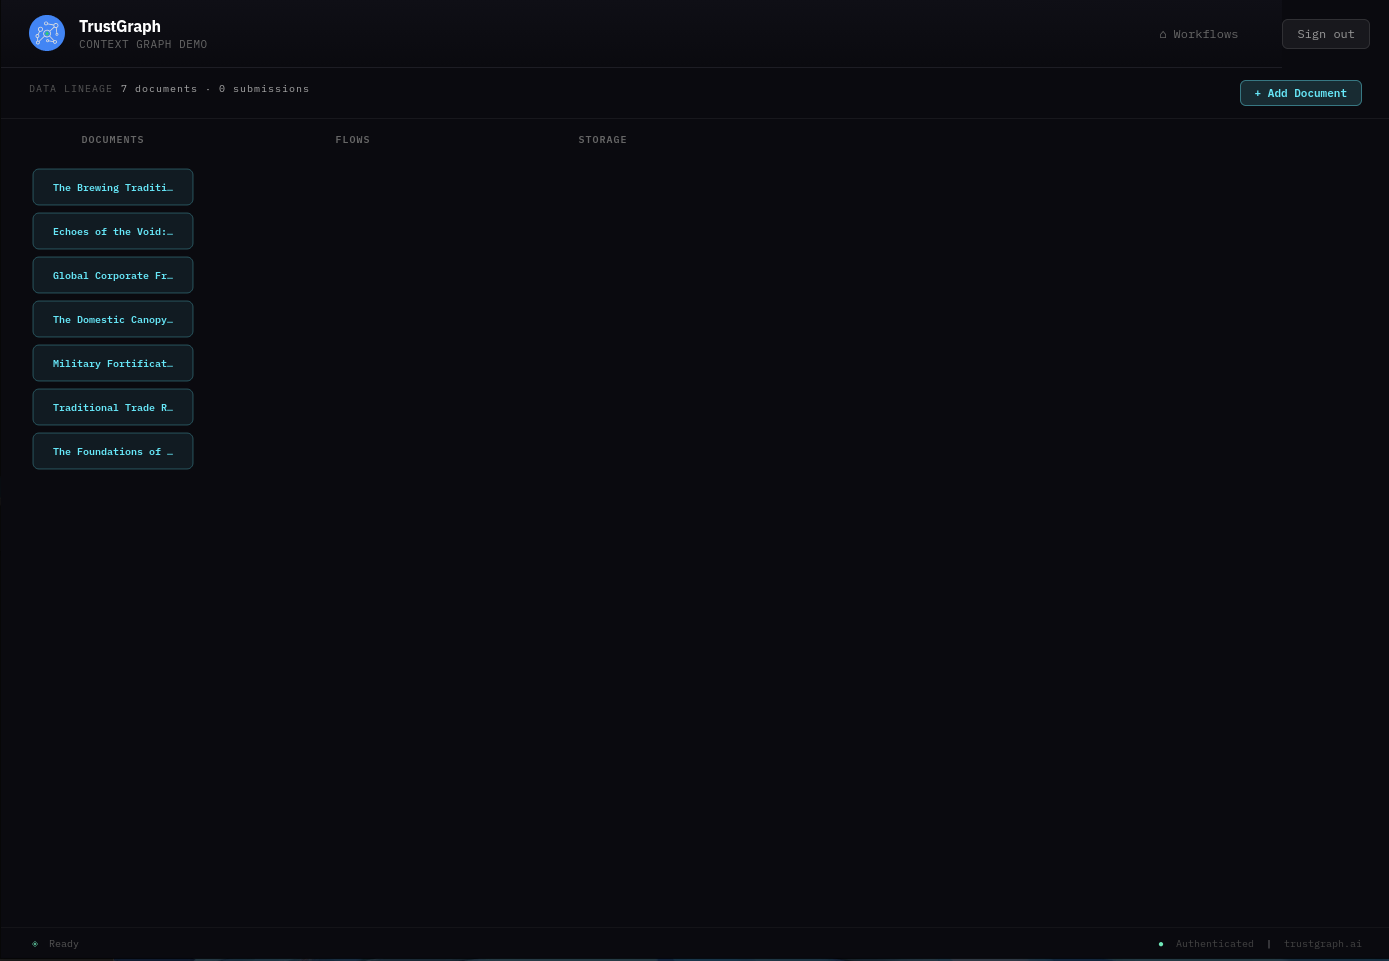
Find Echoes of the Void and select it. You should see document information including a description, tags, and upload date.
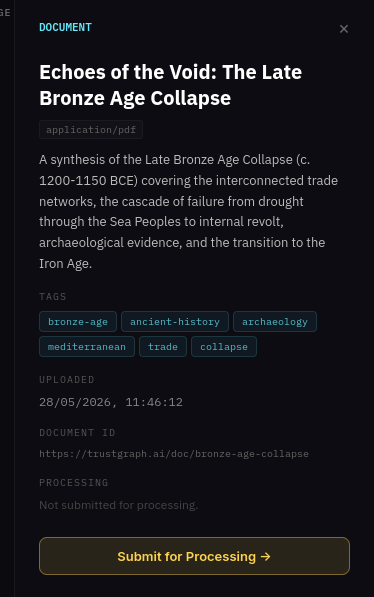
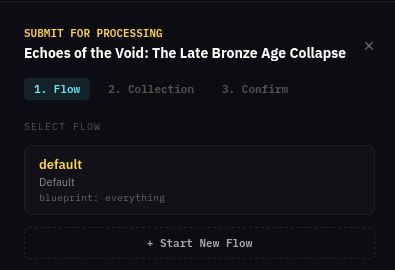
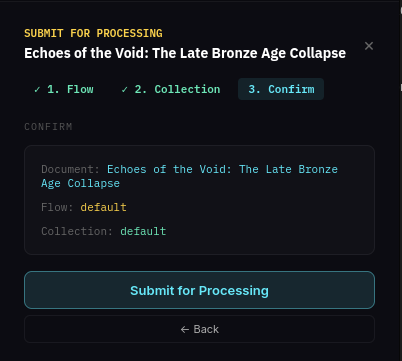
Click Submit for Processing. The submission wizard has three steps:
1. Select a flow — choose the default flow which already exists.
2. Select a collection — use the existing default collection.
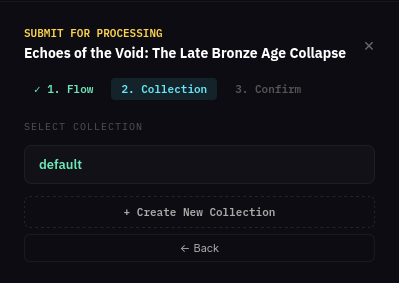
3. Confirm — review the details and click Submit for Processing.
If submission is successful, the main screen should show the document’s processing pipeline — the document flowing through the selected flow into the storage backends.
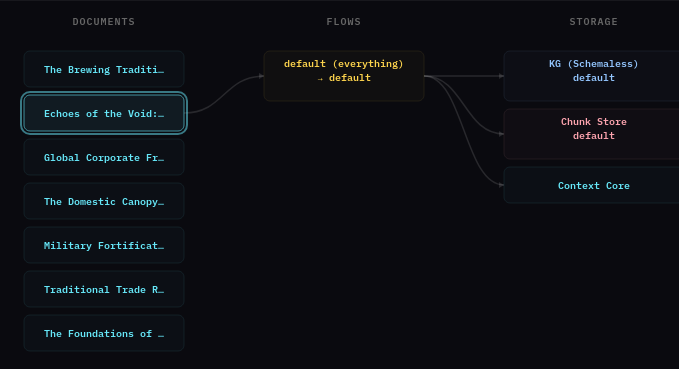
This is a short document and should process quickly, depending on the LLM resource you are using.
There is also an + Add Document button in the top right which can be used to submit your own documents.
Look at knowledge graph
From the Workflows page, select Graph Explorer. This shows what’s in the knowledge graph with tools for viewing and searching.
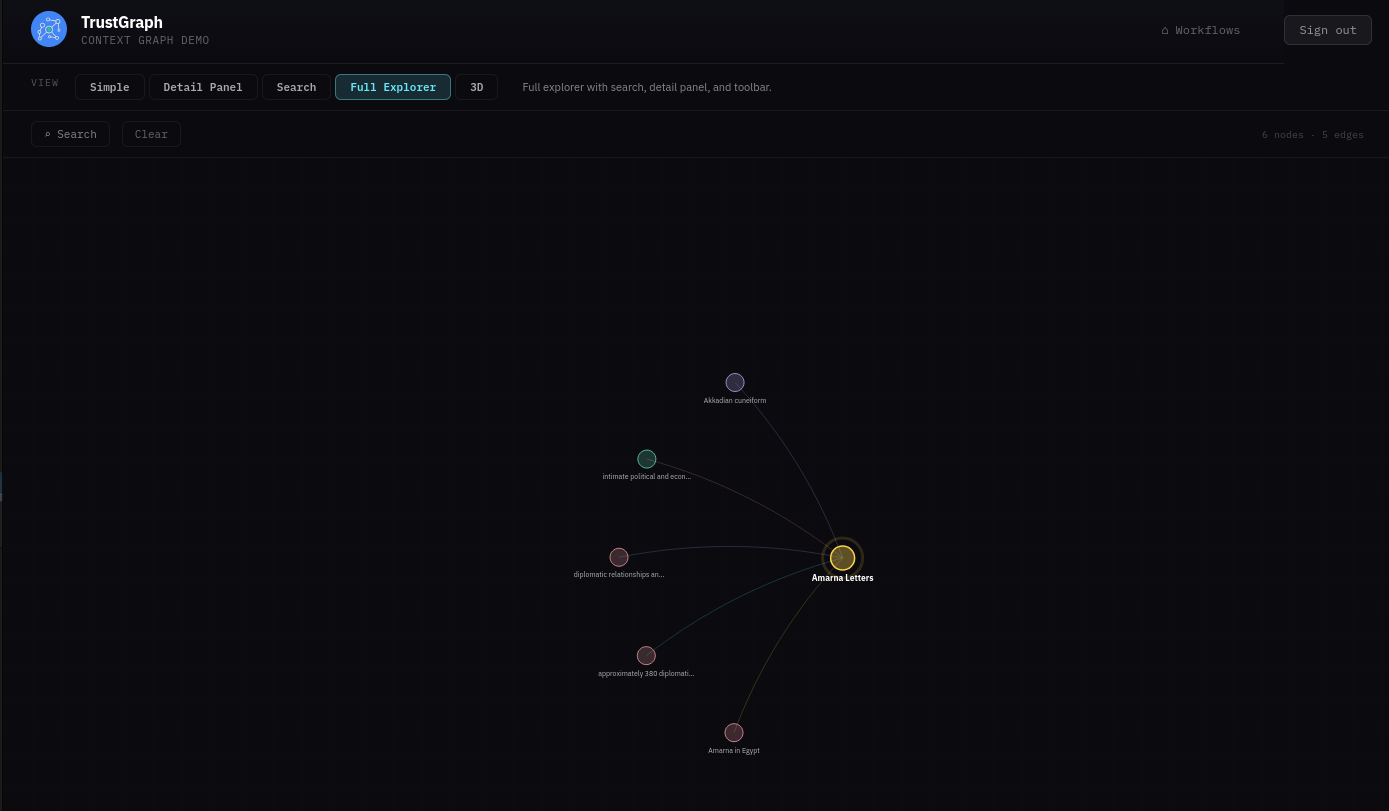
The graph can be easier to see in 3D — click the 3D button above the graph view.
If you click a node, it will be highlighted along with its related edges. A side panel also appears showing node properties and highlighted links that allow you to navigate to related nodes.
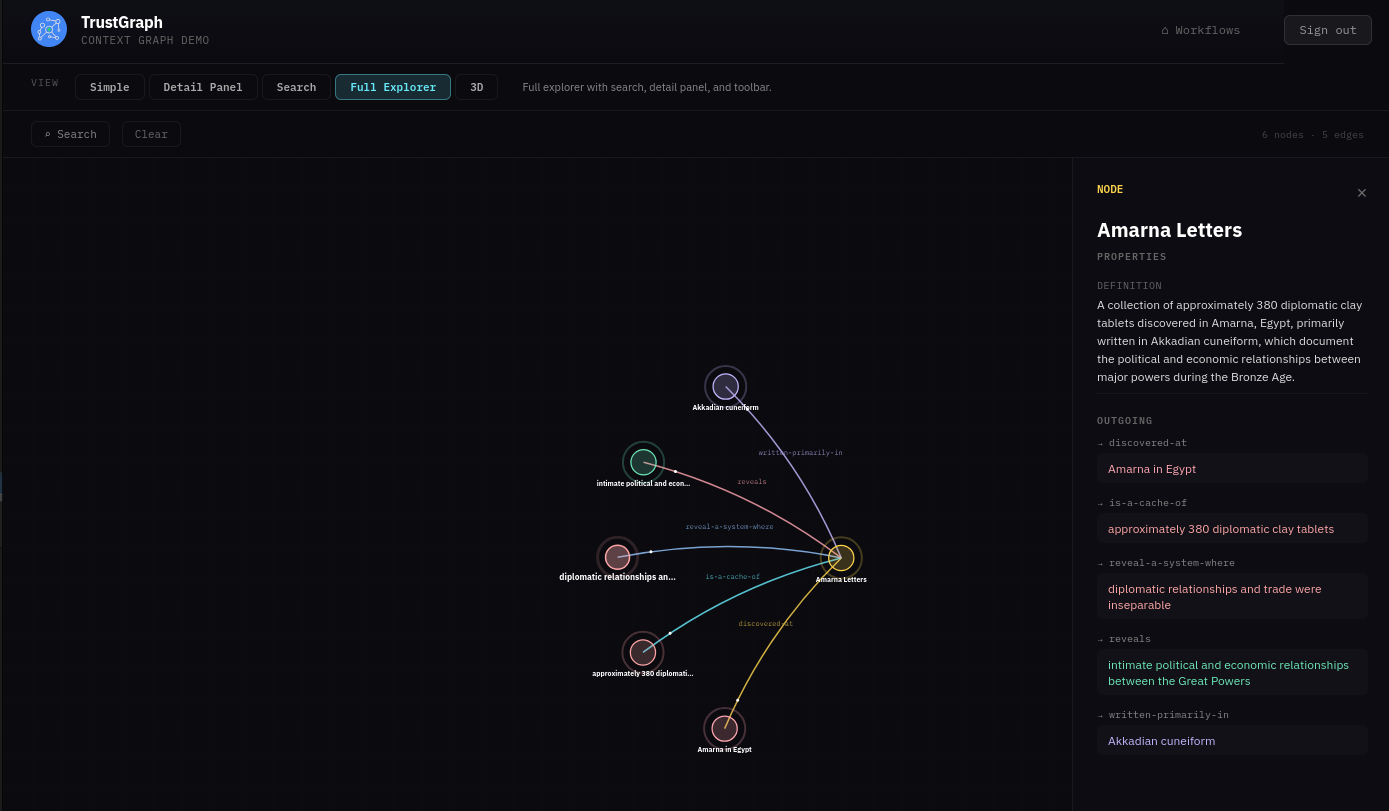
On the top left is a Search button which opens a search dialog. You can enter text for a similarity search against nodes in the graph. Matching nodes are listed and can be selected, which adds them to the graph along with their neighbours.
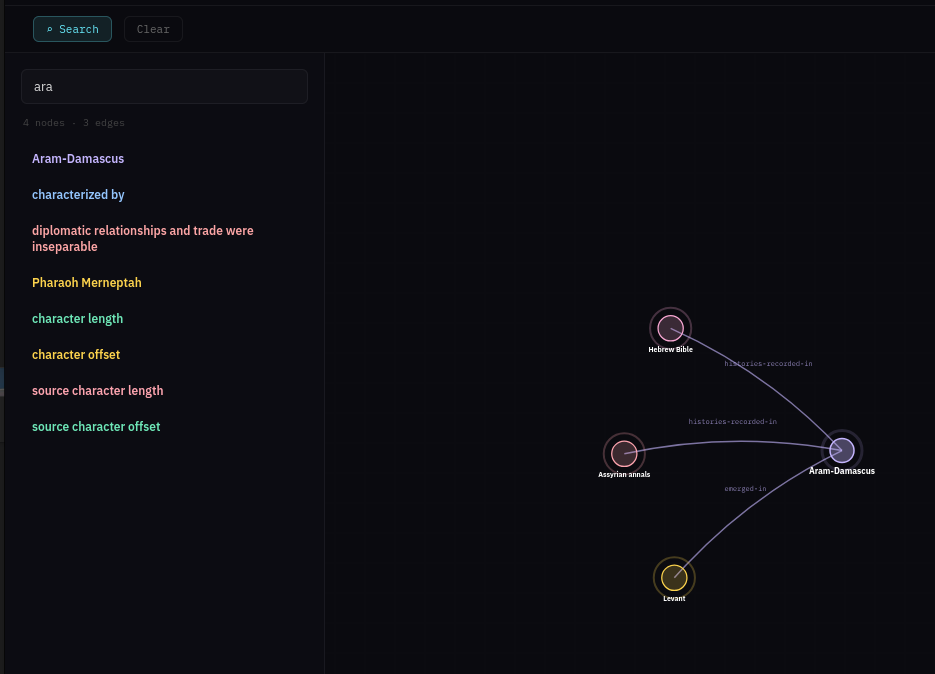
There is also a Clear button which resets the graph back to an empty state.
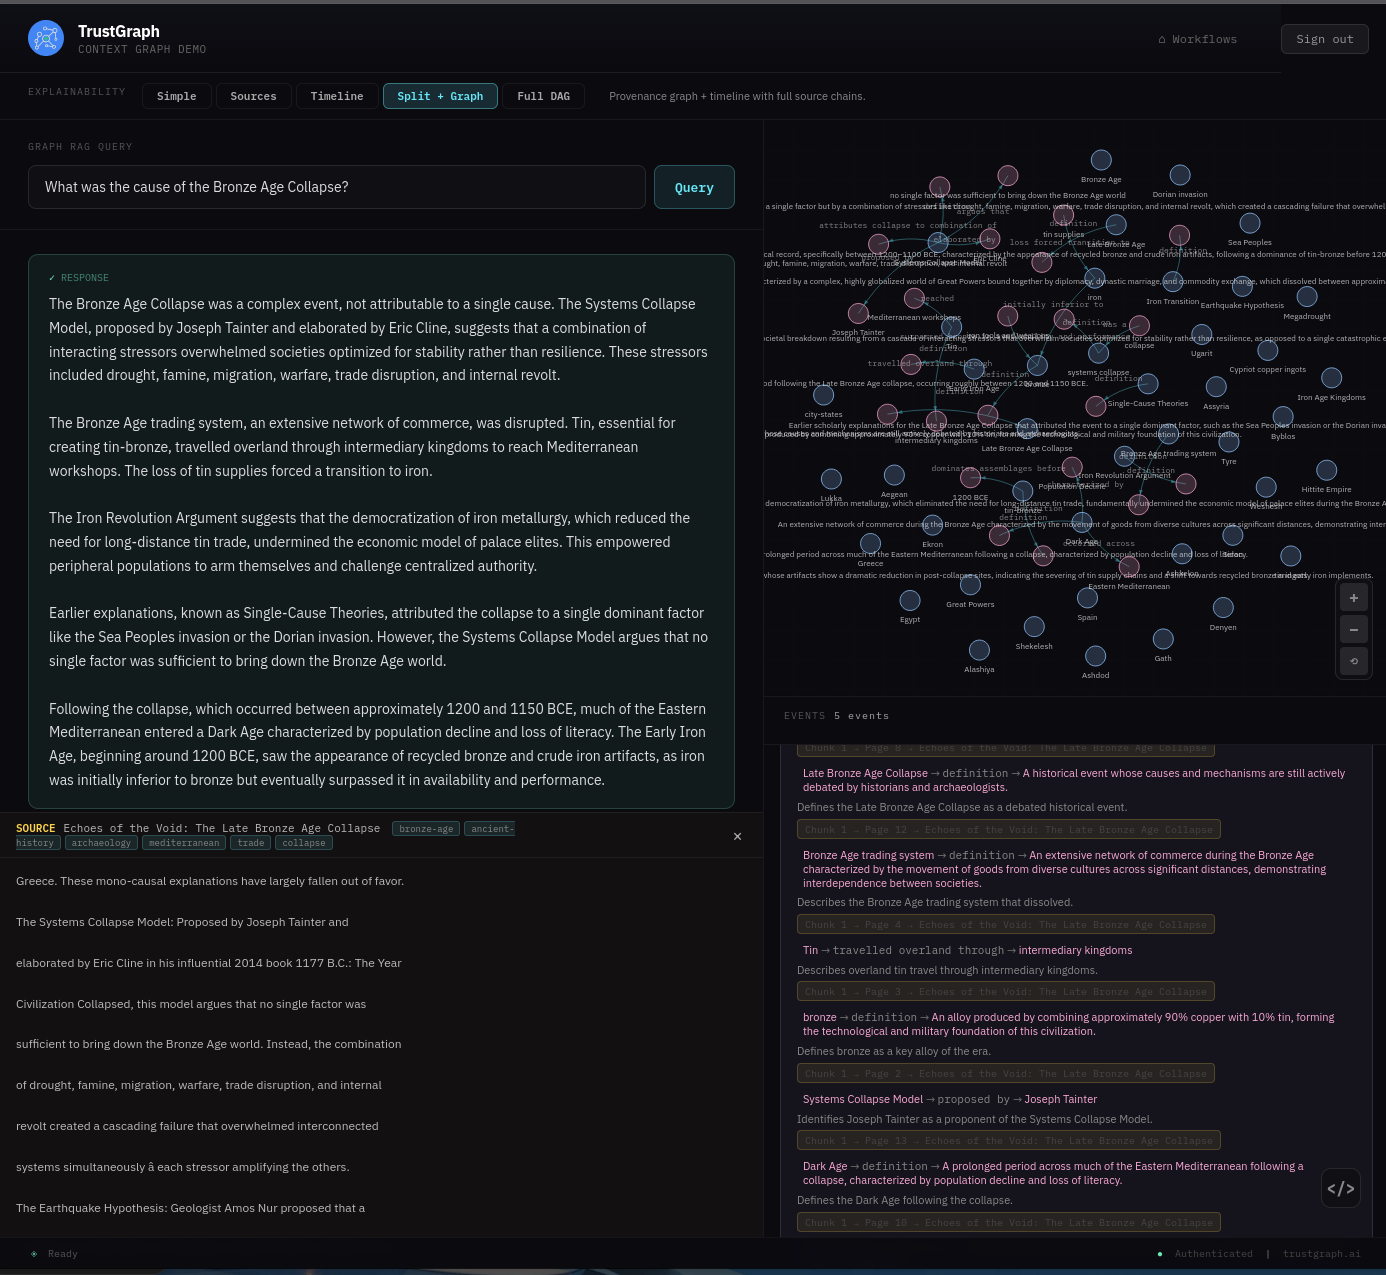
Query with Graph RAG
From the Workflows page, select Graph RAG Query. This console is more than your average chatbot — it has full Explainable AI enabled. This helps to understand and diagnose retrieval, but is not intended as an end-user experience.
Enter a query such as “What was the cause of the Bronze Age Collapse?” and after a short while you should see a response.
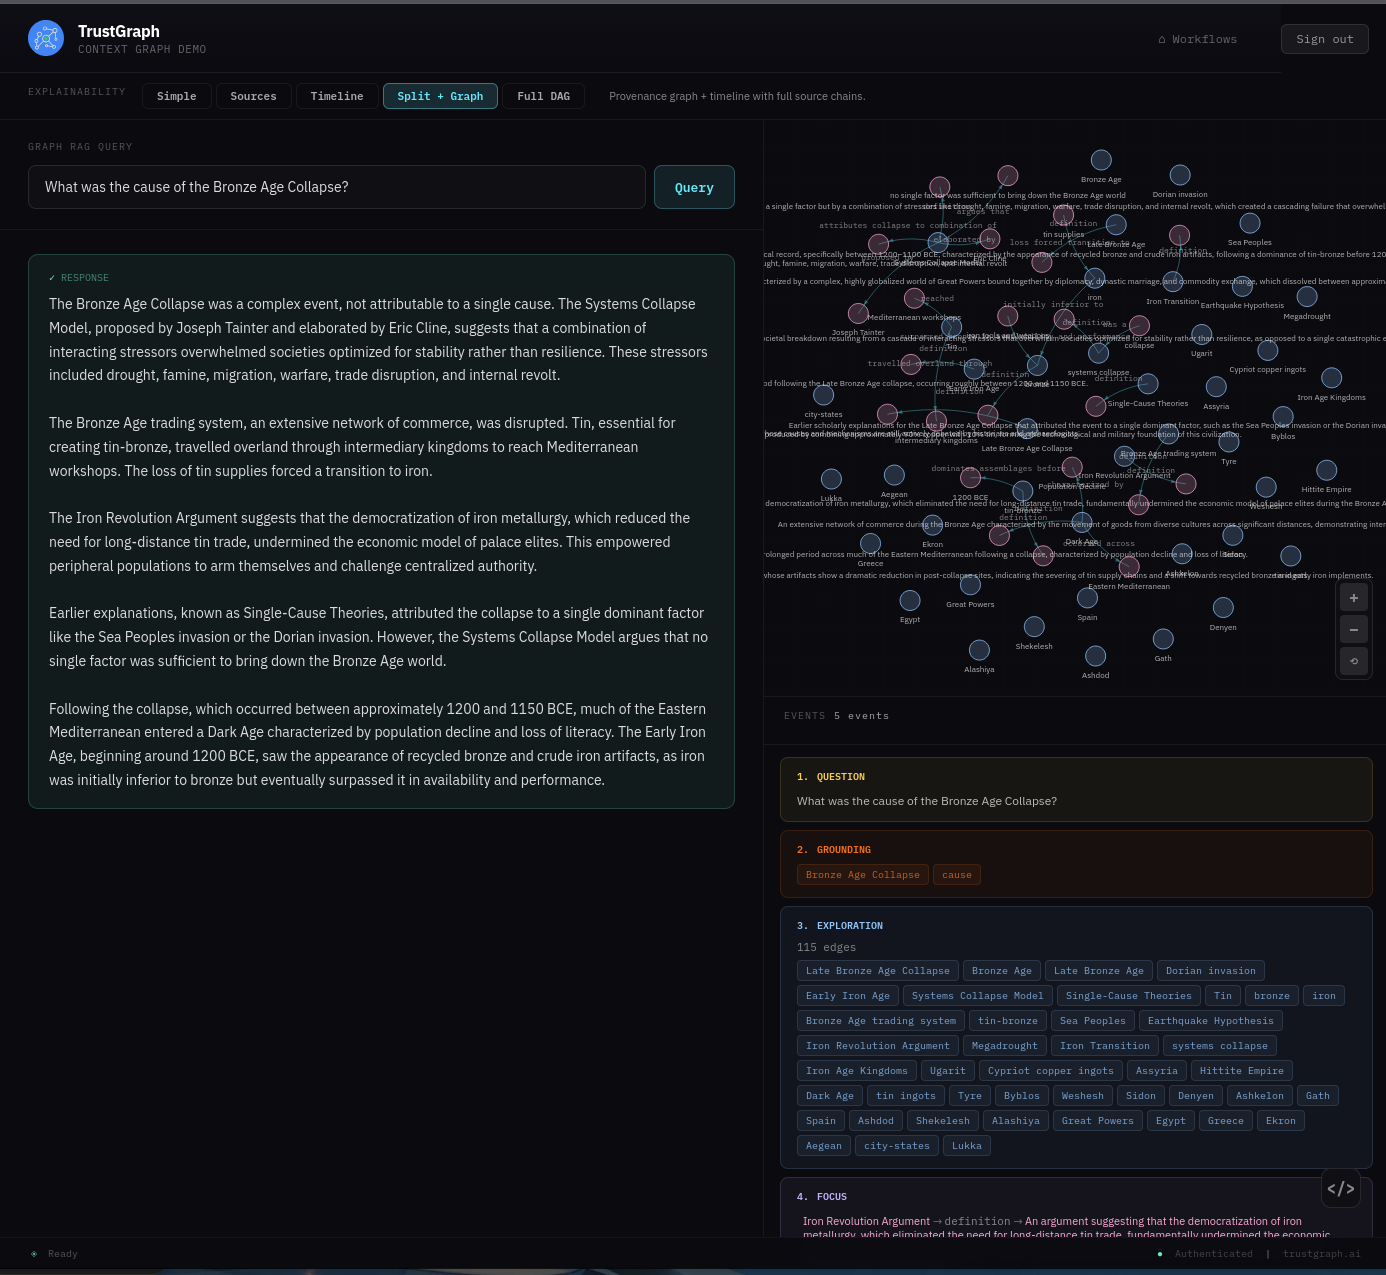
There is a lot to see here if you are interested. The bottom right part of the screen shows the various explainability events, starting from the question:
- Grounding — where retrieval selects key concepts for discovery
- Exploration — where graph nodes are selected for analytics
- Focus — where the system decides on a core set of graph edges to resolve the question
- Synthesis — where this is processed to provide an answer
On the left-hand side you see the actual answer to the query. The Focus event may be of particular interest as you can trace graph edges all the way back to the source documents. For example, the graph edge (Systems Collapse Model → proposed by → Joseph Tainter) has a link to source below which, when followed, shows the original source text.
Shutting down
Clean shutdown
Once you have finished with your system, you can close it down. The easiest way is to reverse the launch operation you ran up:
docker-compose -f docker-compose.yaml down -v -t 0
podman-compose -f docker-compose.yaml down -v -t 0
The -v option specifies to delete all data volumes. The -t 0 option directs to close down containers without delay - the default is to wait for clean shutdown.
Manual cleanup
If the compose shutdown has problems, you can check and see what containers are running with the docker/podman tools.
# Confirm no containers running
docker ps

# Confirm volumes removed
docker volume ls
# Confirm no containers running
podman ps

# Confirm volumes removed
podman volume ls
Troubleshooting
Service Failure
Run out of memory
Diagnosis:
Check which containers are running. Init containers (names ending in -init) should show Exited (0) - this is normal. Other containers should be running.
# Show all containers
docker ps -a

# Find OOM-killed containers (exit code 137)
docker ps -a --filter 'exited=137'

# Inspect a failed container for details
docker inspect <container-name> | grep -A 5 "OOMKilled\|Error"
# Show all containers
podman ps -a

# Find OOM-killed containers (exit code 137)
podman ps -a --filter 'exited=137'

# Inspect a failed container for details
podman inspect <container-name> | grep -A 5 "OOMKilled\|Error"
Look for "OOMKilled": true or error messages in the inspect output.
Resolution:
- Docker Desktop: Increase memory allocation in Settings → Resources
- Alternative: Run on a machine with more available memory (16GB+ recommended)
Hitting major CPU resource limits
Diagnosis:
System is very slow to start, taking several minutes to become available. Operations are sluggish. Check CPU load:
# Monitor CPU usage
top

# Or use htop if available
htop
If CPU load remains very high (near 100%) for an extended period during startup and operations, this indicates insufficient CPU resources or an older CPU architecture struggling with the workload.
Resolution:
Migrate to a device with more CPU cores or a newer CPU architecture. TrustGraph requires 8 CPUs minimum, but more cores or faster processors will improve performance significantly.
Configuration volume mount access restriction
Diagnosis:
Check for failures in containers that need configuration files (Prometheus, Grafana, Loki). View their logs for permission denied or file access errors:
# Check Prometheus logs
docker logs prometheus

# Check Grafana logs
docker logs grafana
# Check Prometheus logs
podman logs prometheus

# Check Grafana logs
podman logs grafana
Look for errors mentioning “permission denied” or inability to read configuration files.
Resolution:
Review and apply the file permission steps from the Unpack the configuration section, including:
- Setting global-read permissions with
chmod - Configuring SELinux permissions with
chcon(Linux only)
Application error
Diagnosis:
Find failed containers and examine their logs:
# Show all containers
docker ps -a

# View logs for a specific container
docker logs <container-name>

# Follow logs in real-time
docker logs -f <container-name>
# Show all containers
podman ps -a

# View logs for a specific container
podman logs <container-name>

# Follow logs in real-time
podman logs -f <container-name>
Alternatively, view aggregated logs in the Grafana dashboard at http://localhost:3000/ (login with username admin and the password you set in GF_SECURITY_ADMIN_PASSWORD). The Logs dashboard shows all TrustGraph container logs in one place.
Resolution:
Resolution depends on the specific error message. Common issues include configuration errors, missing environment variables, or service dependencies not being ready.
LLM Failure
LLM configuration error
Diagnosis:
The system appears to be running but LLM connectivity is not working. Test LLM connectivity:
tg-invoke-llm '' 'What is 2+2'
A long timeout or error indicates LLM configuration issues. Check the Grafana logs dashboard at http://localhost:3000/ for application logs. Look for errors in the text-completion container logs which indicate LLM connection failures.
Resolution:
Review the LLM configuration settings in the Configure LLM settings section. Common issues include:
- Missing or incorrect API keys
- Wrong endpoint URLs
- Missing
/v1suffix for self-hosted models - Incorrect
host.containers.internalhostname for local services
Locally-hosted LLM connectivity error
Diagnosis:
Check the Grafana logs dashboard for connectivity errors in the text-completion container. Look for errors indicating connection refused, timeouts, or unreachable hosts when attempting to connect to your LLM service.
Resolution:
Review your network connectivity and addressing configuration:
- Verify your LLM service is running and accessible
- Check the URL configuration for your LLM (environment variables like
OLLAMA_HOST,LMSTUDIO_URL,VLLM_URL, etc.) - For services on the same host, ensure you’re using
host.containers.internalas the hostname - Verify the correct port number
- Ensure URLs include
/v1suffix where required
See also:
Next Steps
- Guides: See Guides for things you can do with your running TrustGraph